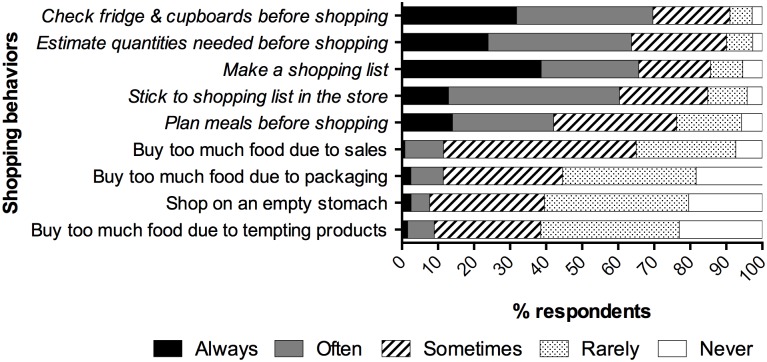
Fig 3. Reported Frequency of Shopping Behaviors.
Responses to five-point Likert-type questions about the frequency of performing nine behaviors related to food shopping. Percentages indicate the proportion of respondents who chose each response. Behaviors classified as “food waste reducing” are italicized; behaviors classified as “food waste promoting” are non-italicized.

