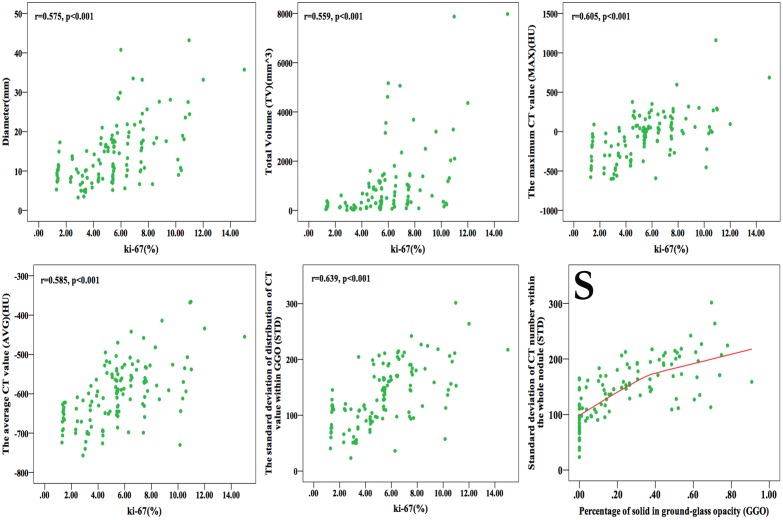
Fig 6. Graphs showing the correlation between Ki-67 labeling index (LI) and diameter, total volume (TV), the maximum CT value (MAX), average CT value (AVG), standard deviation of CT value within the whole nodule (STD) respectively, and correlation between STD and percentage of solid component in ground-glass opacity (GGO) nodule.
(r means correlative coefficient) Diameter, TV, MAX, AVG and STD were positive correlation with Ki-67. Graph (S) shows that in the heterogeneous model of GGO, STD increase along with solid component growing in it instead of decrease after solid-part more than 50% of nodule.

