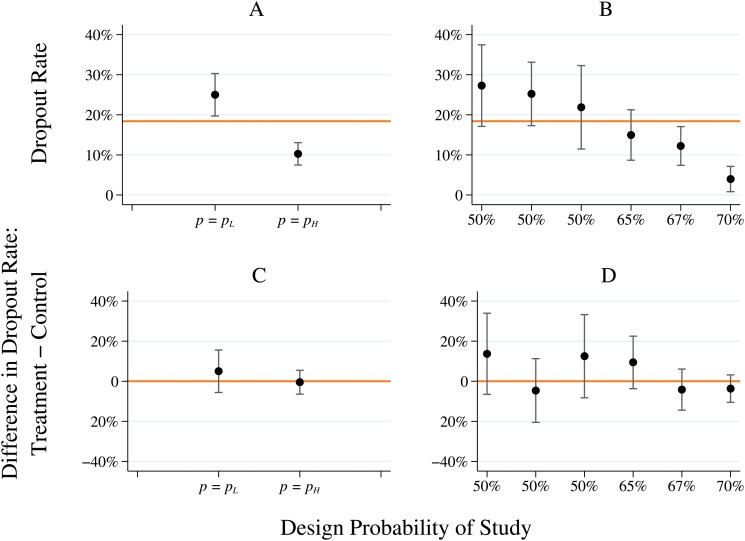
Fig 2. Dropout rates are significantly higher in low-probability trials.
(A) and (B) show the dropout rate for low versus high treatment probability trials, and for all six individual trials, respectively. (C) and (D) show the difference in the dropout rate when comparing participants who were treated versus those that received no treatment. All graphs show point estimates (dots) and 95% confidence intervals centered at the point estimate.

