
Figure 2.
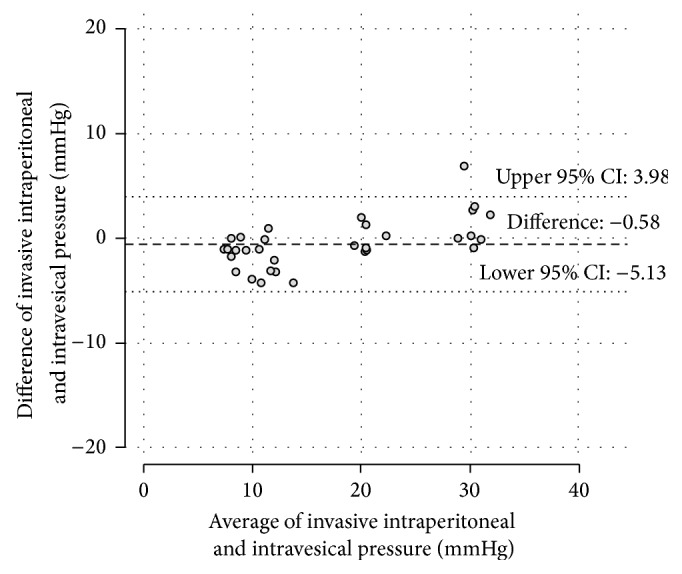
The Bland-Altman diagram plots the differences against the averages of simultaneous IAP measurements from the intravesical probes and the invasive piezoresistive probe values. No obvious signs of an increasing inaccuracy with rising values are indicated.