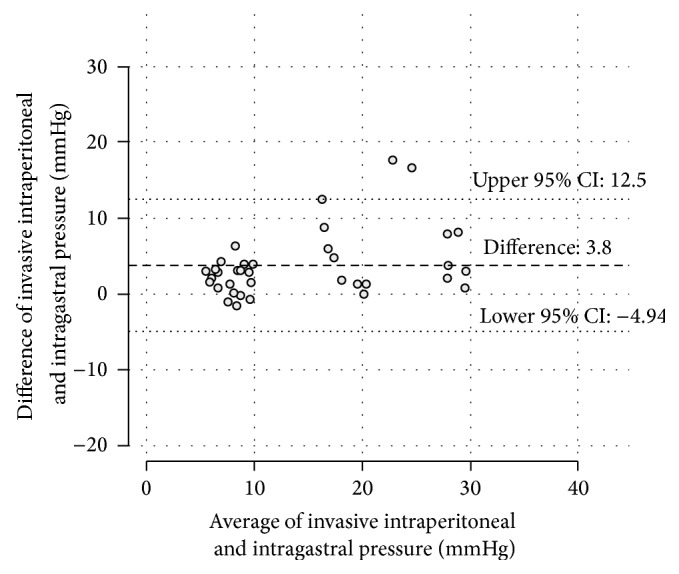
Figure 3.

The Bland-Altman diagram plots the differences against the averages of simultaneous IAP measurements from the intragastric probes and the invasive piezoresistive probe values. An increasing divergence between the measurement modalities from the 20 mmHg plateau towards the 30 mmHg plateau is indicated.
