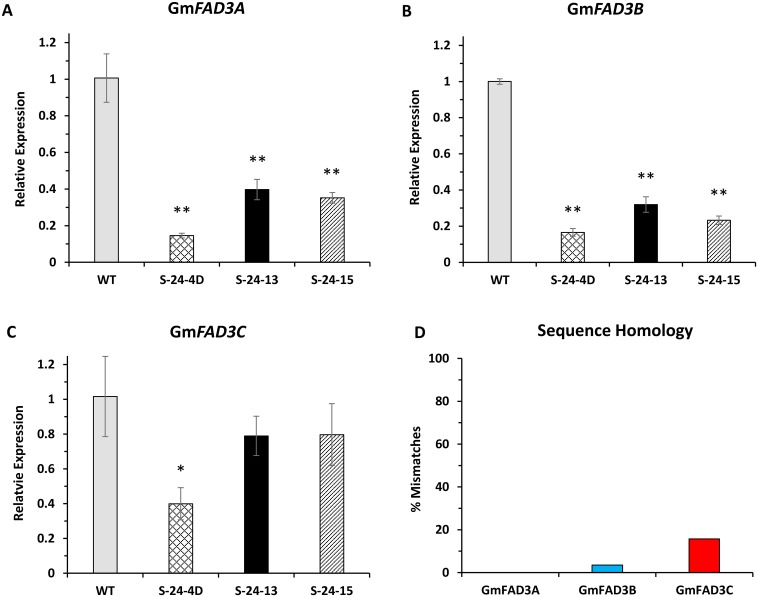
Fig 1. FAD3 gene expression level of T5 homozygous RNAi lines.
Data are averages of biological triplicates ± SD normalized to CONS7 mRNA. Independent-Samples T Test was used to test the significance. Asterisks indicate significant differences in relative expression between transgenic lines and control. (*, p < 0.05; **, p < 0.01). S24-4D, S-24-13, S-24-15 are T5 homozygous for the pMUFAD transgene. Soybean cultivar Jack is used as wild-type control. (A) to (C) Normalized gene expression level of GmFAD3A, GmFAD3B and GmFAD3C, respectively. The values of wild-type plants were arbitrarily fixed to 1.0. (D) Percentage of mismatches between the 318-bp IR and corresponding regions in GmFAD3A, GmFAD3B and GmFAD3C, respectively.

