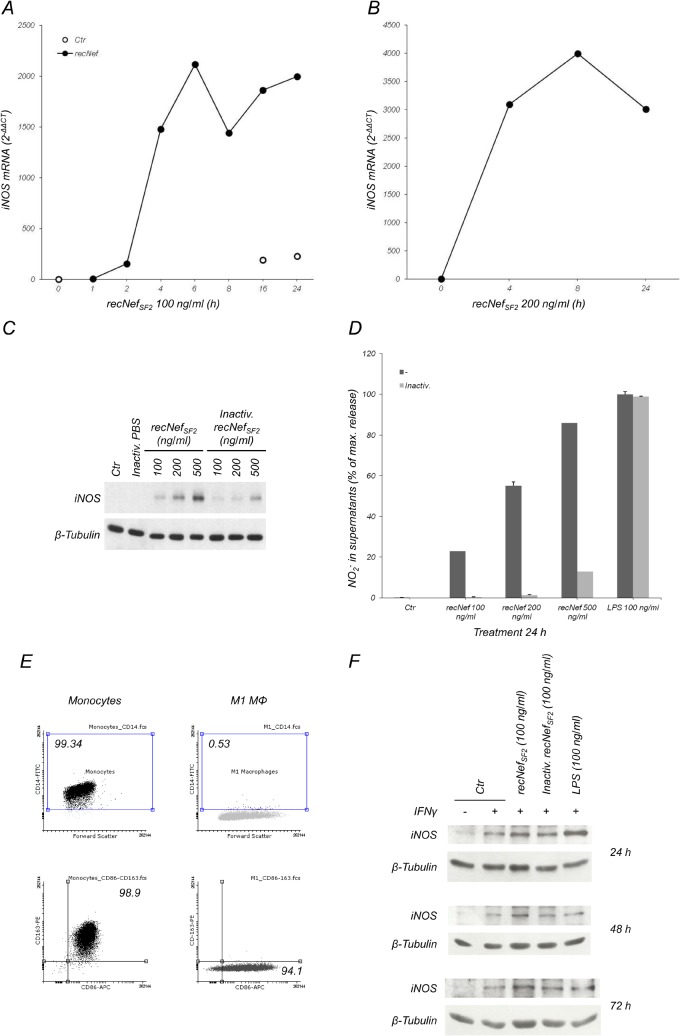
Fig 2. Nef treatment of microglial cells induces iNOS expression.
BV-2 cells (A) or purified primary murine microglial cells (B) were treated for the indicated time with myr+NefSF2 (100 ng/ml in A, 200 ng/ml in B, closed circles). Total cellular RNAs were isolated and real time RT-PCR analysis was performed as reported in the materials and methods section. Results were expressed using the 2-ΔΔCT method using basal mRNA level in untreated cells (Ctr, open circles) at T = 0 as a calibrator and GAPDH level as an internal loading control. (C, D) BV-2 cells were treated for 24 h with the indicated amounts of myr+NefSF2, heat inactivated myr+NefSF2 (Inactiv. recNef), LPS or heat treated LPS. Total cell lysates were analyzed by Western Blot for iNOS (C, upper panel) levels and, as internal loading control, β-Tubulin expression (C, lower panel). (D) NO2 - content in the supernatants was quantified using the Griess colorimetric assay as reported in the materials and methods section. Dark gray bars: native myr+Nef or LPS. Light gray bars: heat pre-treated (Inactiv.) myr+Nef or heat pre-treated LPS. Results from one of five independent experiments are shown. (E) Cell phenotyping by flow cytometry of human monocytes and M1 macrophages obtained as described in materials and methods. According to [77], human monocytes were CD14+/CD163+/CD86+ whereas M1 macrophages were CD14-/CD163-/CD86bright. (F) M1 human macrophages were left untreated or treated for 24, 48 and 72 h with IFNγ, 100 ng/ml wild type myr+NefSF2 plus IFNγ, heat pre-treated myr+NefSF2 and IFNγ or 100 ng/ml LPS plus IFNγ. Total cellular extracts were analyzed by Western Blot to evaluate iNOS expression using specific antibodies as described in materials and methods. β-tubulin expression as internal loading control. Blots are representative of two independent experiments.

