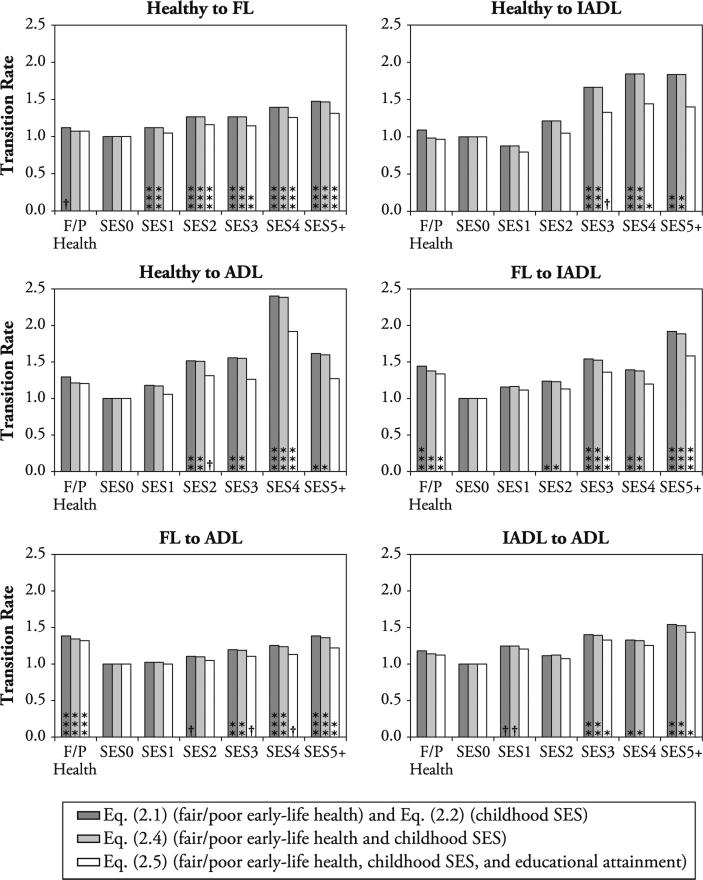
Fig. 1.
Antilogs of transition rate coefficients reflecting deterioration in functioning. FL = functional limitations; IADL = difficulty with instrumental activities of daily living; ADL = difficulty with basic activities of daily living; Healthy = no FL, IADL, or ADL; and SES = socioeconomic context. †p < .10; *p < .05; **p < .01; ***p < .001

