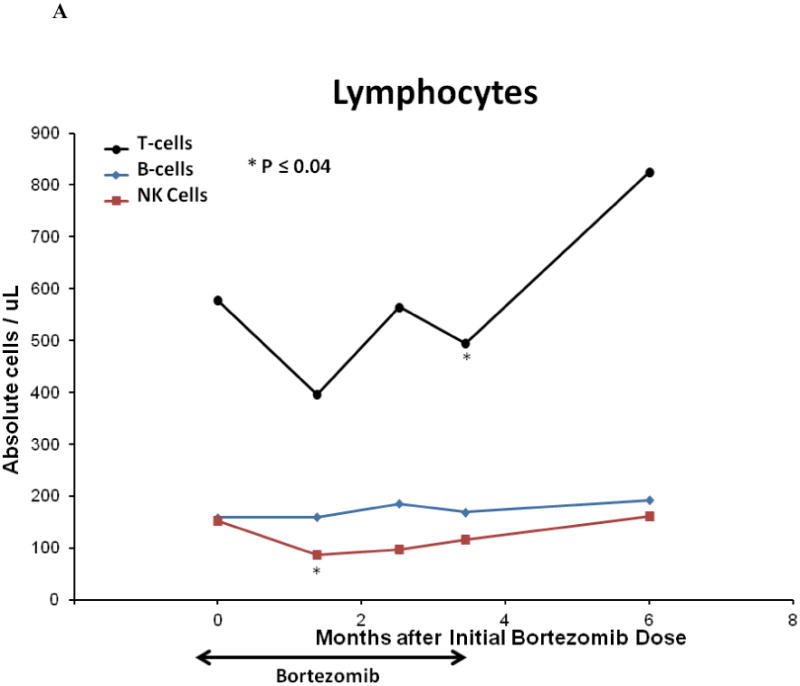
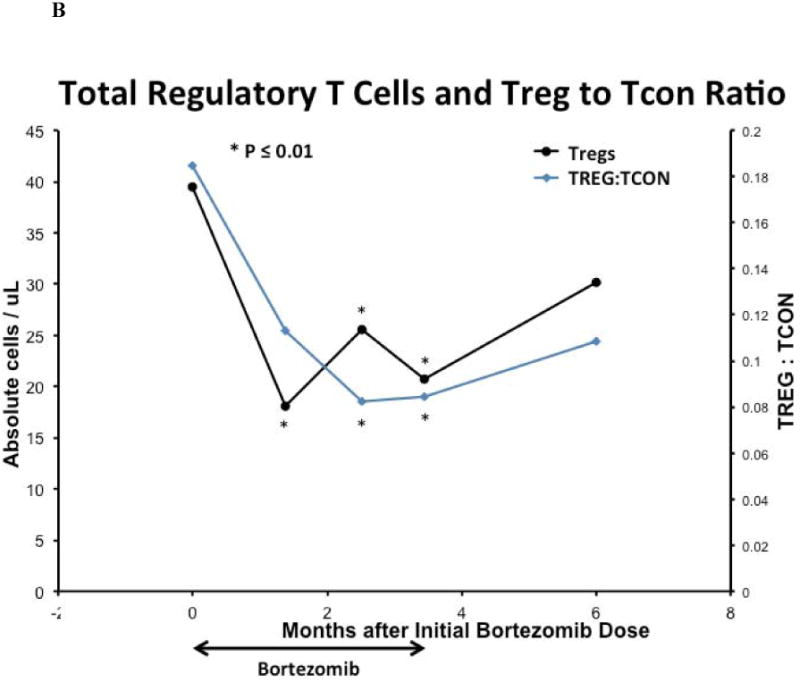
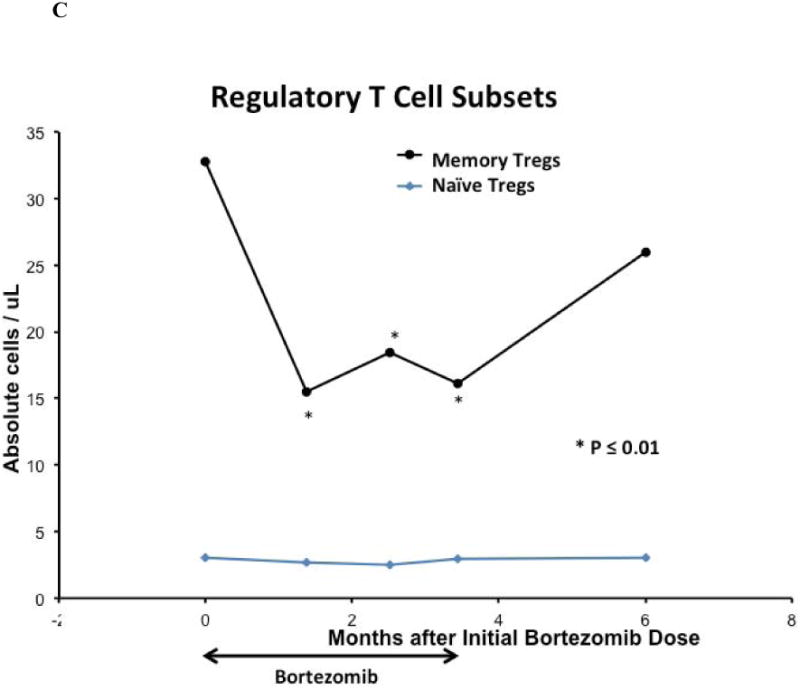
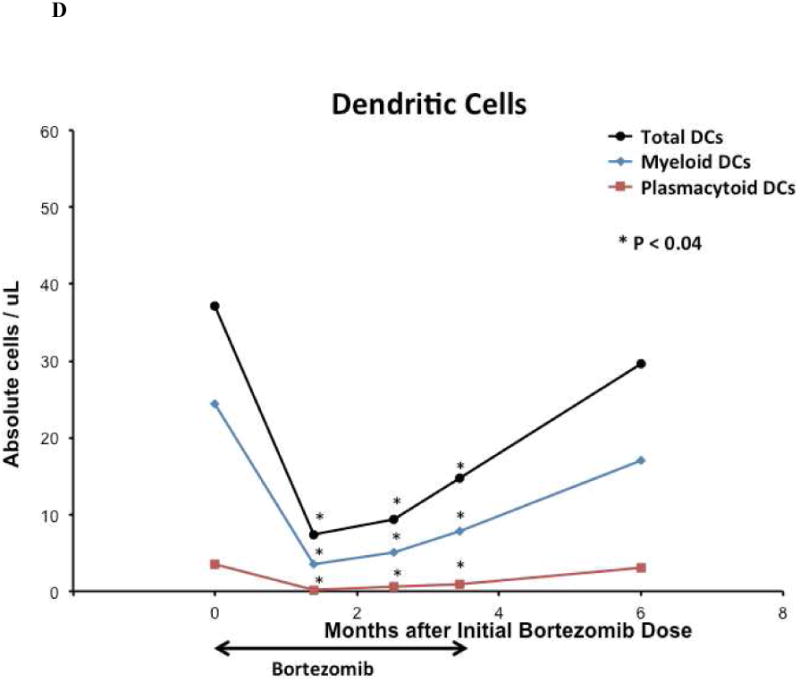
Figure 4. Immune Correlates.


(A) Median peripheral blood T, B, NK lymphocyte lineage counts, (B) median peripheral blood total regulatory T-cell count and Treg:Tcon ratio, (C) median peripheral blood regulatory T-cell subset counts, (D) and median peripheral blood total and dendritic cell subset cell counts on bortezomib and prednisone therapy. For all analyses, n = 21 at baseline; n = 18 at week 6, n = 19 at week 11, n = 19 at week 15, and n = 10 at 6 months after initial bortezomib dose. Cell counts were compared between time points using the Wilcoxon-signed-rank test. Asterisk denotes statistically significant (p ≤ 0.05) change at a time point compared to baseline.
