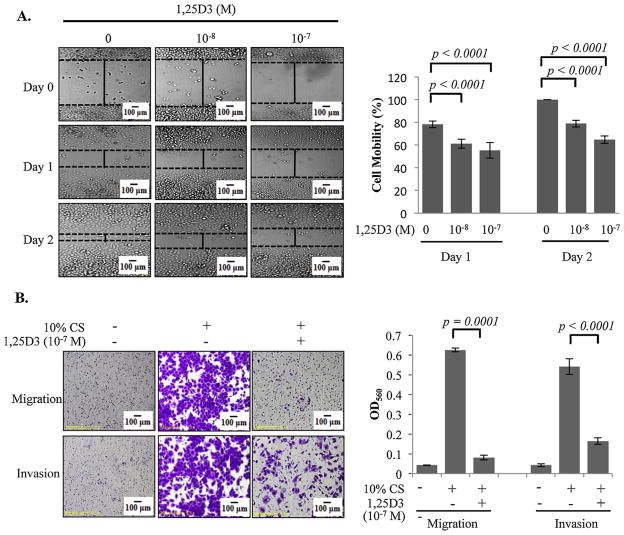
Fig. 1.
Suppression of EOC migration and invasion by 1,25D3 in monolayer scratch and transwell assays. (A) In vitro monolayer scratch assays. OVCAR3 cells were pre-treated with 1,25D3 at indicated concentrations for 6 days. Ethanol (EtOH) was used as the vehicle control. Images of cells at 0, 1 and 2 days after wounding are shown (magnification × 10). The histograms show % cell mobility by imaging analyses as described in Section 2. (B) Transwell migration and invasion assays. 1 × 10⁵ cells of OVCAR3 cells pretreated with EtOH or 10−7 M 1,25D3 were plated and incubated for 18 h at 37 °C. Cells passing through the Matrigel-coated membrane were stained (left panels) and quantified using a spectrophotometer at OD560 (bar graphs). For each data point, triplicate samples were analyzed. The experiments were reproduced twice.

