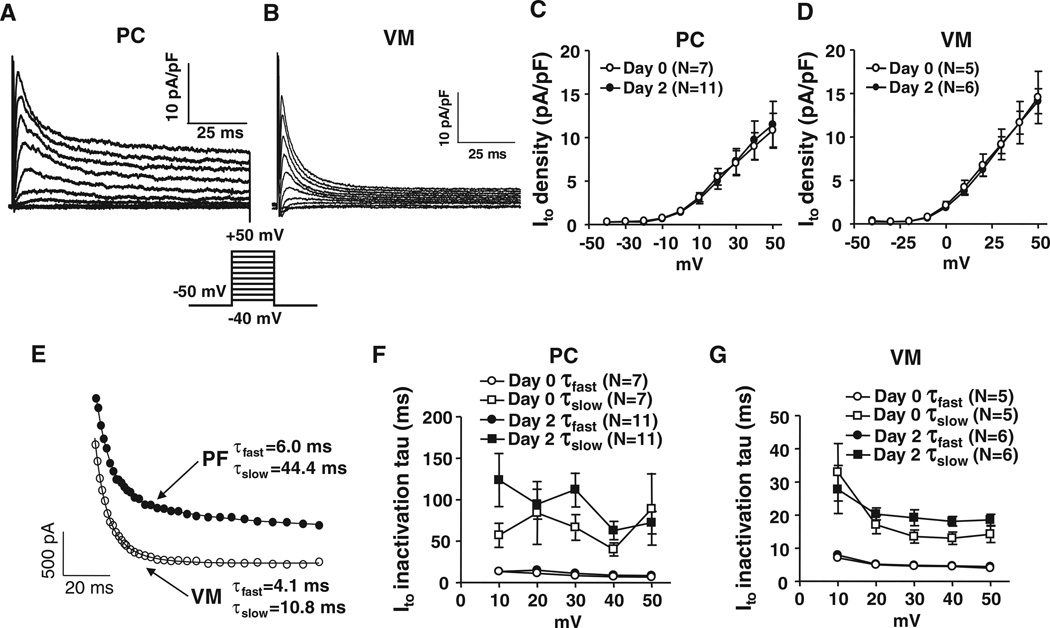
Figure 2. Comparison of Ito between Purkinje fiber cells (PCs) and ventricular muscles (VMs).
Representative recordings of Ito obtained with 100-millisecond depolarizations from a holding potential of −50 mV at 0.1 Hz in freshly isolated PCs (A) or VMs (B). C and D, Mean±SEM Ito density-voltage relations at day 0 (freshly isolated) and day 2 culture for PCs and VMs. E, Representative best-fit biexponentials to data from a PC and a VM during 100-millisecond depolarizations to 30 mV. F and G, Mean±SEM Ito inactivation time constants.

