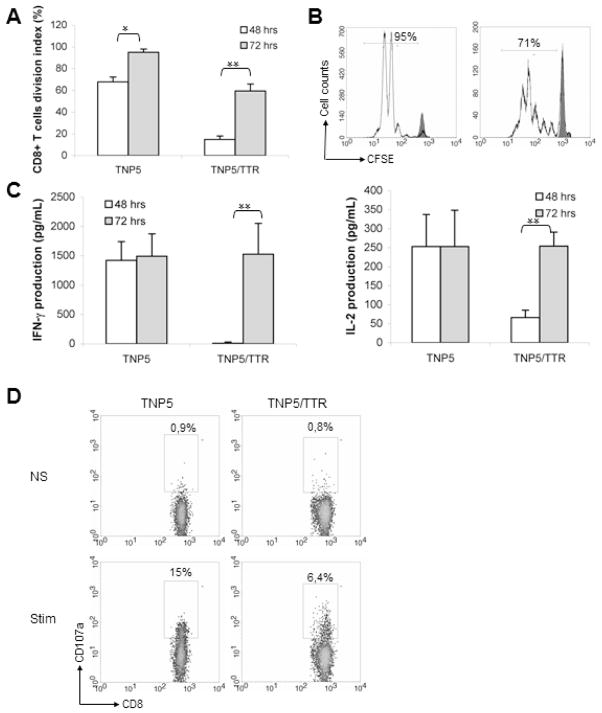
Figure 3.
Functional capacity of Tg TCR CD8+ T lymphocytes. (A) The cell division index (CDI) was assessed for the proliferative capacity of NP-specific Tg CD8+ T cells after 2 or 3 days of culture in both STg and DTg mice. The CDI was calculated by substracting the percentage of CFSElow in the CD8+ subset (%CFSElow /CD8+) found in unstimulated cultures from %CFSElow /CD8+ found in stimulated cultures (mean ± SD of 5 independent experiments, n=5–7 mice per group). *p<0.05; **p<0.001. (B) Representative FACS analysis of NP396-404-stimulated splenocytes and unactivated (gray filled) after 3 days of culture. Equivalent numbers of naive spleen cells from either TNP5 or TNP5/TTR-NP mice were assessed for proliferation in response to NP396-404 peptide. Numbers in the diagrams display the percentages of proliferating NP-specific CD8+ T-cells gated on CD8+ T cells subset. The background proliferation (M1) for both mice was 2.5–4 % (data not shown). (C) Supernatants of NP396-404 peptide-stimulated splenocytes were analyzed for IFN-γ and IL-2 production in both STg and DTg mice. Non-Tg mice were used as negative controls (data not shown). (Mean ± SD of 3 independent experiments, n=5–6 mice per group). **p<0.001. (D) To assess the cytotoxic function, Tg splenocytes stimulated with NP396-404 peptide or without (NS) after 4h of culture were used in exocytosis assays in which CD107a (LAMP-1) detection reflects the release of granzymes by CTL to kill specific targets. The representative flow cytometry showed the proportion of CD107a+ cells within the CD8+ T lymphocyte population from TNP5 and TNP5/TTR-NP mice.

