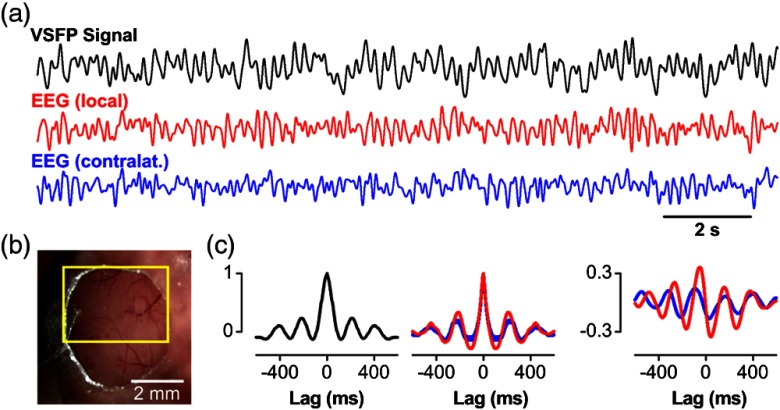
Fig. 2.
Comparison of VSFP recording and cortical electroencephalogram (EEG): (a) VSFP Butterfly-1.2 signal (black) recorded from a large region of interest (ROI) over somatosensory cortex [see (b)] along with EEG signals from ipsilateral (red) and contralateral cortex (blue) showing spontaneous rhythmic cortical activity of a mouse under deep pentobarbital anesthesia. Signals are low-pass filtered with 10-Hz cutoff. (b) Optical window for transcranial voltage imaging of somatosensory cortex. The yellow rectangle marks the ROI used to extract the VSFP signal shown in (a). (c) Autocorrelations of VSFP (left) and EEG signals (middle) and cross-correlations (right) of the VSFP signal [black trace in (a)] with ipsilateral (red) and contralateral (blue) EEG signals. Data adapted from Ref. 68

