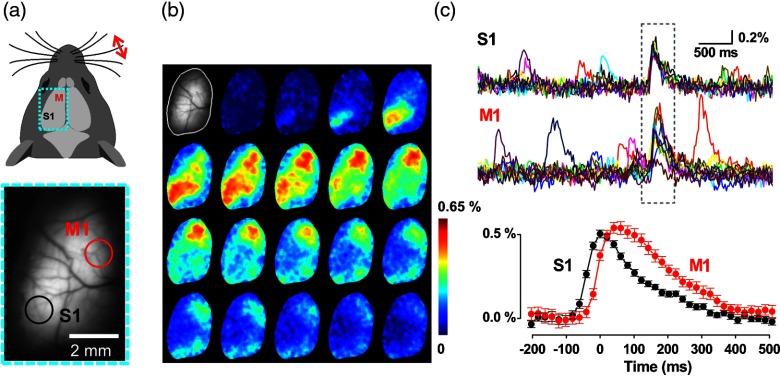
Fig. 3.
Whole hemisphere VSFP imaging of sensory-evoked and spontaneous cortical electrical activity: (a) Top: schematic dorsal view of the mouse head with imaging region of the left cortical hemisphere indicated as dotted rectangular (cyan). Donor (mCitrine) and acceptor (mKate2) were recorded with two synchronized CCD cameras at in 4 s trials with 30 s intertrial interval with a tactile stimulus (single deflection) delivered to the contralateral C1 whisker via a piezo drive triggered by the imaging clock after 2 s baseline recording. Bottom: transcranial mCitrine fluorescence image of the left cortical hemisphere. (b) Poststimulus, single-trial time lapse sequence (20 ms interval) of images after spatial filtering with a Gauss filter. The first image (gray scale) shows the mCitrine baseline image with pixels outside of the optical window masked. (c) Top: time courses of 25 consecutive trials of primary sensory (S1) and primary motor (M1) signals over ROIs outlined in (a). The time window of stimulus response is indicated as dotted rectangle. Depolarizing events outside of this time window are spontaneous. Bottom: Average of the evoked S1 and M1 responses (25 trials) at enlarged time scale.

