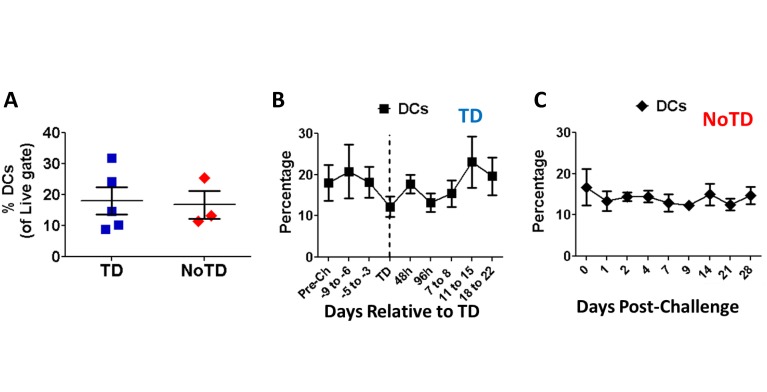
Fig 5. DCs levels in peripheral blood following infection with wt S. Typhi.
The percentages of circulating DCs in TD (squares; n = 5) and NoTD (diamonds; n = 3) volunteers were compared to the levels before wt S. Typhi challenge (A) as well as in subsequent days (B and C). The graphs display mean ± SE.

