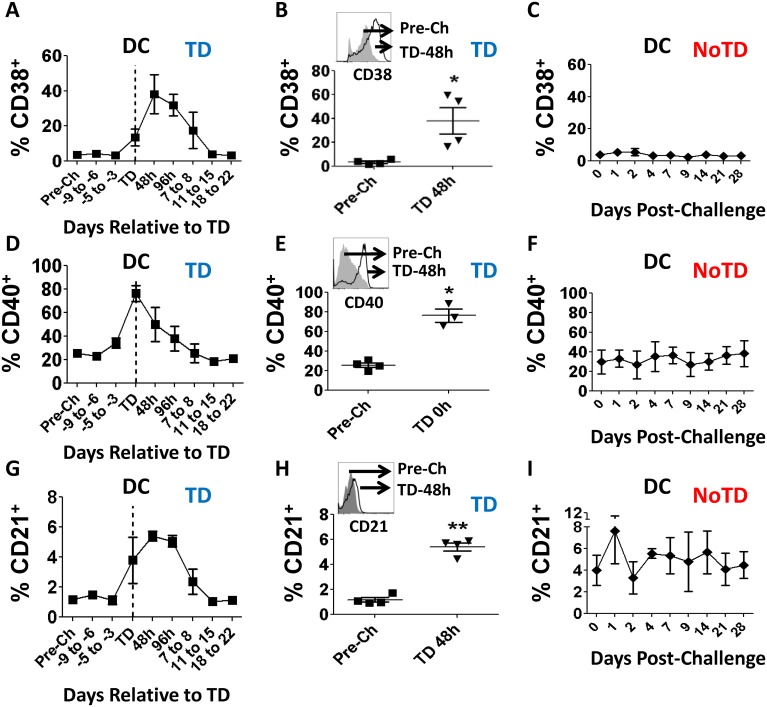
Fig 6. Changes in CD38, CD40 and CD21 expression in DCs following wt S. Typhi challenge.
Shown in panels A, D and G are the time courses of the changes in CD38, CD40 and CD21 expression, respectively, in TD volunteers. Shown in panels B, E and H are the data in individual volunteers at pre-challenge (squares) and peak up-regulation times (TD-0h or TD-48h) (inverted triangles) for these markers in TD volunteers. The histogram insert contains an example of the up-regulation for each marker, in a representative volunteer. Shown in panels C, F and I are the time courses of expression of CD38, CD40 and CD21 in NoTD volunteers. Statistical significance compared to pre-challenge is indicated by: * p<0.05; **p<0.005 (Dunnett’s multiple comparison test).

