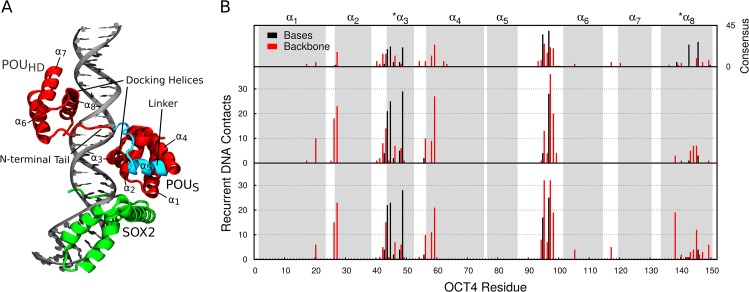
Fig 1. Interactions and structural changes at the protein-DNA interfaces.
(A) The OCT4-SOX2-UTF1 complex. (B) Per-residue number of recurrent protein-DNA contacts. The top plot shows the number of contacts in a model of the OCT4-SOX2-HOXB1 (consensus sequence) complex as reference. The middle and bottom plots show the data from the unbiased simulations of the OCT4-DNA and OCT4-SOX2-DNA complexes respectively. The gray boxes highlight the 8 helices of OCT4. α1 – α4 correspond to the POUS, α6 – α8 to the POUHD. See also S1 and S2 Figs.

