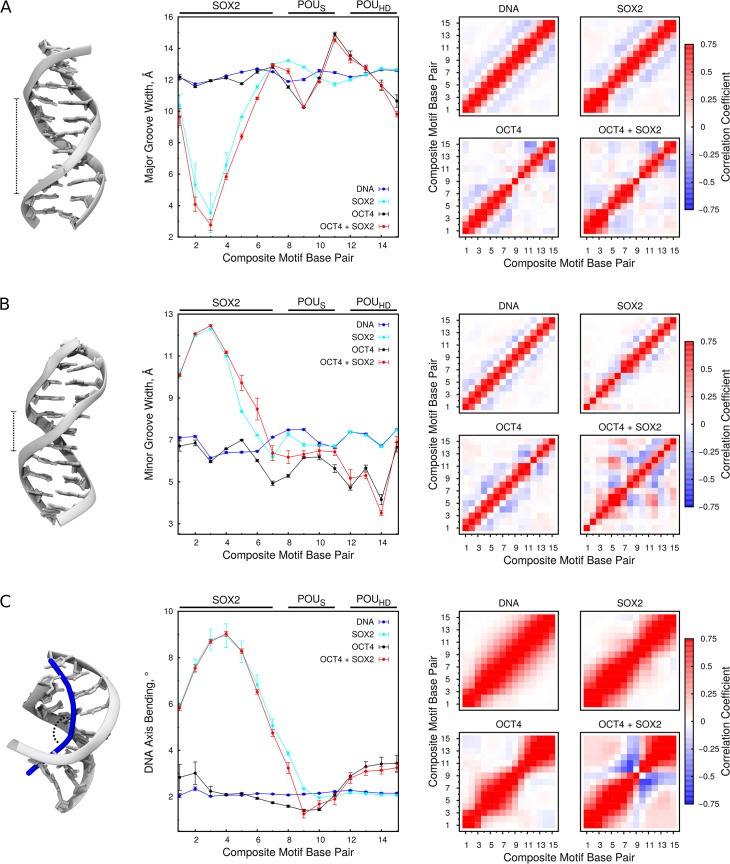
Fig 4. Effect of OCT4 and SOX2 binding on the DNA structural properties.
(A) Major groove width (B) Minor groove width (C) Axis bending. On the left schematic representations of analyzed properties are drawn. The plots in the middle show the average values with standard errors (see Methods), whereas the plots on the right the inter base pair correlations. The data was collected from the four ensembles of unbiased simulations (free DNA, and SOX2-DNA, OCT4-DNA, OCT4-SOX2-DNA complexes).

