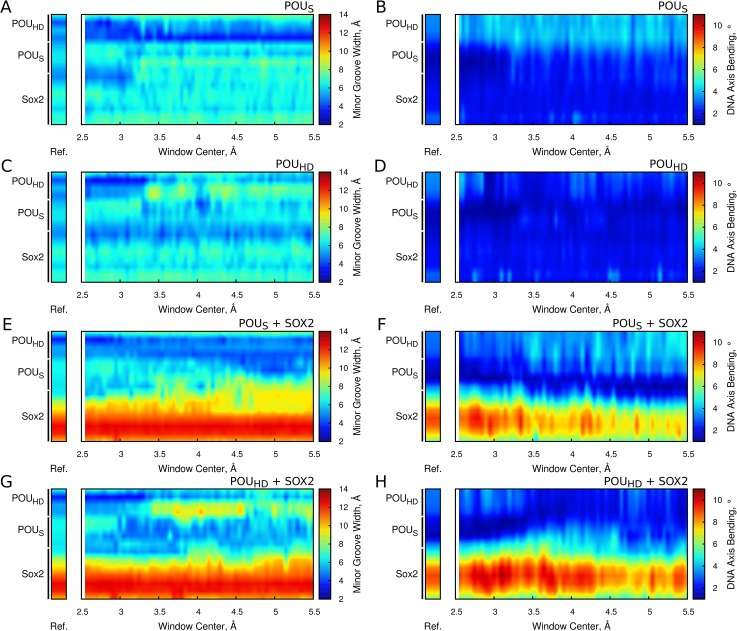
Fig 7. Changes in DNA structure during the biased simulations.
The effect of the unbinding on the conformation of the composite DNA motif is shown in the absence (A-D) or the presence (E-H) of SOX2. The pulled domain was the POUS (A,B,E,F) or the POUHD (C,D,G.H). The properties analyzed were the minor groove width (A,C,E,G) and the bending of the DNA axis (B,D,F,H). For each plot, the average obtained from the unbiased simulations is shown as a color bar reference.

