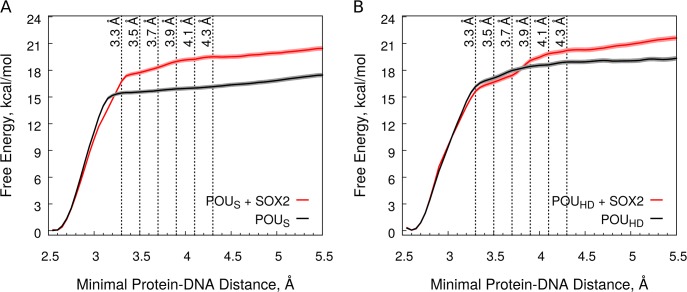
Fig 8. Unbinding free energy profiles.
(A) POUS. (B) POUHD. The black and red curves show the profiles in absence and presence of SOX2 respectively. The dotted vertical lines mark the different bound-unbound thresholds tested (Table 1.). The shaded lines represent the error calculated as described in Methods. See also S6 Fig.

