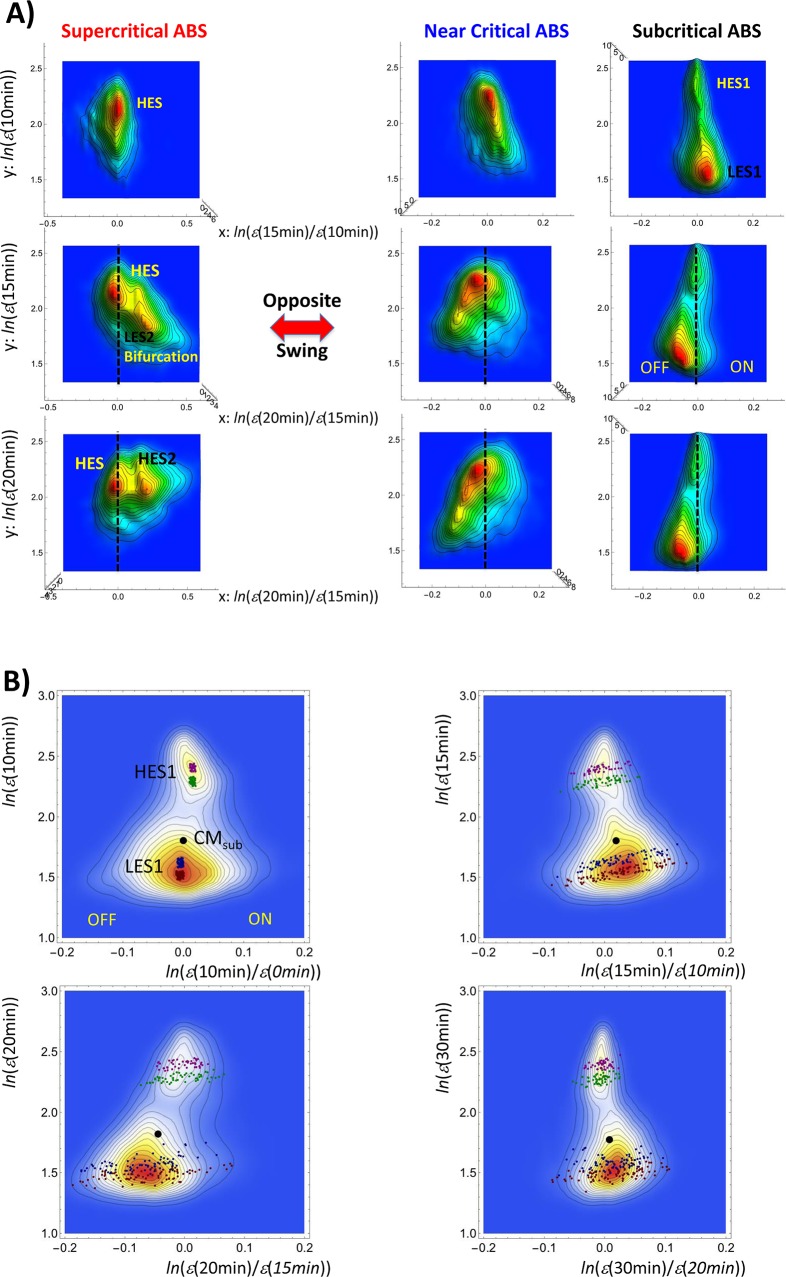
Fig 6. Anti-phase behavior of autonomous bistable switches (ABSs) between super- and sub-critical states.
A) Pseudo-3-D probability density profiles on the regulatory space show the opposite ON-OFF oscillation of coherent expression states (low- and high-expression states (LES and HES) with x = 0 (marked by a vertical dashed line) in ABS between super- and sub-critical & near- critical states (left column: ABS of super-critical; center: near-critical: right: sub-critical). The x-axis shows the (natural log) expression change at 10–15 min (first row), 15–20 min (second), and 20–30 min (third); the y-axis shows the (natural log) expression for 10 min (first row), 15 min (second), and 20 min (third). In the super-critical ABS, LES2 is bifurcated at 15 min, becomes HES2 at 20 min, and annihilated at 30 min (refer to Fig 4B). B) Sensitivity to the initial conditions of the temporal dynamics of groups of mRNAs at different expression initially localized around x = 0 (indicated by purple, green, blue and red squares; left top) in a sub-critical ABS represented as a 2-D density profile (N = 9059 mRNAs). The groups refer to two coherent expression states–two groups are in a high-expression state (HES1), the other two in a low-expression state (LES1)—of the sub-critical ABS on the regulatory space (left top: 0–10 min vs. 10 min; right top: 10–15 min vs. 15 min; left bottom: 15–20 min vs. 20 min; right bottom: 20–30 min vs. 30 min). The figure reveals amplification in the expression change (x-axis) but not in expression (y-axis). This behavior indicates a highly correlative behavior for expression and stochastic resonance effect for the expression change. The black solid dot indicates the center of mass of sub-critical ABS(CMsub).

