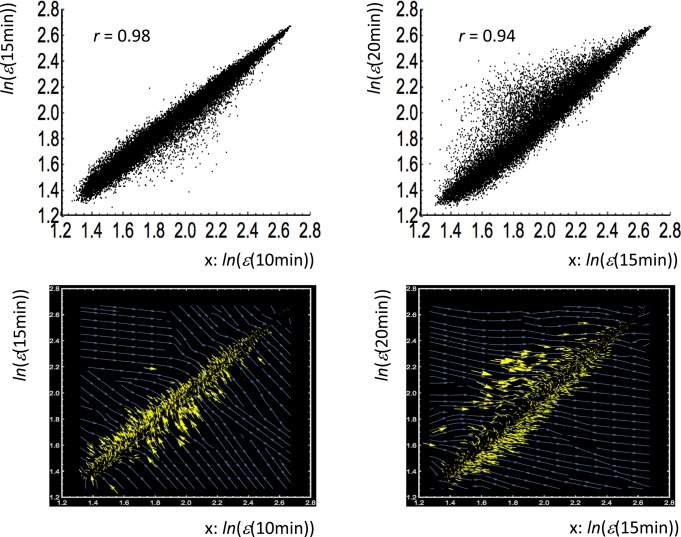
Fig 10. Genome-wide attractor on mRNA expression vector field.
First row: profile-correlation of the whole expression between different time points (left: 10 min vs. 15 min; right: 15 min vs. 20 min) have a near to unity correlation—Pearson correlation coefficient, r = 0.98 in 10 min vs. 15 min (left), r = 0.94 in 15 min vs. 20 min (right). Each point represents single expression point, (x i(t j) = ln(ε(t j)), y i(t j) = ln(ε(t j+1)) (i = 1,..N = 22035), where ln(ε(t j)) is natural log of mRNA expression at t = t j (t j = 10 min, 15 min). The near to unity correlations between gene expression profiles coming from the same tissue implies that the global order of expression across different genes is largely invariant and is statistically very reliable. Second row: a stream plot (using Mathematica 10) is generated from vector field values {Δx i(t j), Δy i(t j)} given at specified expression points {x i(t j), y i(t j)}, where Δx i = x i(t j+1)- x i(t j), Δy i = y i(t j+1)- y i(t j). Streamlines of the whole expression vector field (blue lines) are generated and a yellow arrow represents a vector at a specified expression point (plotting every 20th point). The result shows a clear “genome-wide attractor”—an attractor set is represented as a manifold (linear line: y = rx) in the space spanned by the whole mRNA expression of different time points, which suggests temporal invariance of whole-expression profiles acting as genome-wide attractors.

