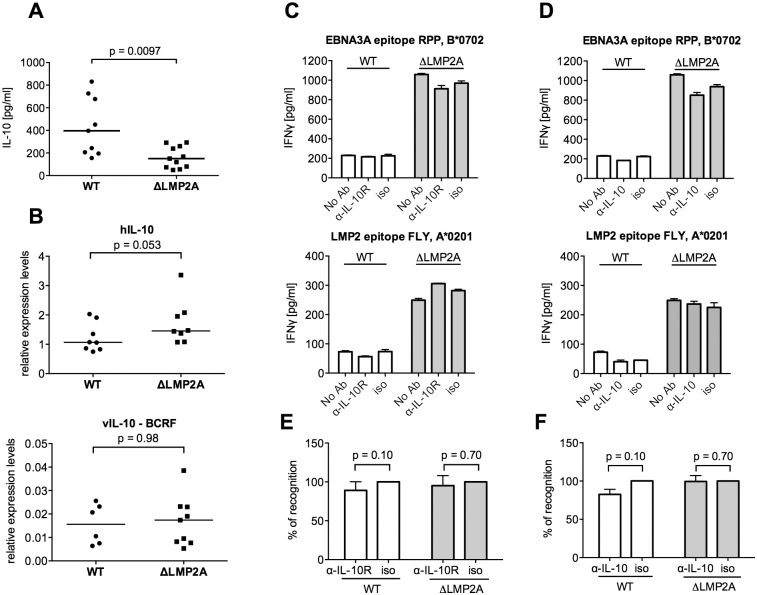
Fig 4. Role of LCL-secreted IL-10 in CD8+ T cell recognition of WT and ΔLMP2A LCLs.
(A) WT and ΔLMP2A LCLs were washed and incubated at 0.5x10⁶ cells/ml for 18 hours, and released IL-10 was measured by ELISA. Each dot represents the mean of quadruplicates for a single independently established cell line. Data shown are representative for three independent experiments. WT and ΔLMP2A lines established from 5 different donors were analyzed in parallel. The horizontal line indicates the median; the Mann-Whitney U test was applied. (B) mRNA levels for human IL-10 and BCRF1 (viral IL-10) were measured by quantitative RT-PCR in WT and ΔLMP2A LCLs. Expression relative to the housekeeping gene GUSB is displayed. Each dot represents an independently established LCL. LCLs were from 4 different donors, WT and ΔLMP2A LCLs from each donor were analyzed in parallel. Data are representative of two independent experiments. The horizontal line indicates the median; the Mann-Whitney U test was applied. (C-F) Reactivity of EBV-specific CD8+ T cell clones against WT or ΔLMP2A LCLs was determined after antibody blocking of the IL-10 receptor on the T cells (C, E) or in the presence of a neutralizing IL-10-specific antibody (D, F). Conditions with no antibody (No Ab) or a matched isotype control antibody (iso) were tested in parallel. After 16 hours, IFN-γ release into the supernatant was quantified by ELISA. Mean and range of duplicates are shown. (C, D) Exemplary experiments. (E, F) Analyses of the relative change in recognition due to antibody blocking, with isotype controls set to 100%. A synopsis of experiments with three different T cell clones with overall mean and SEM is shown. Statistical analysis was performed with the Mann-Whitney U test.

