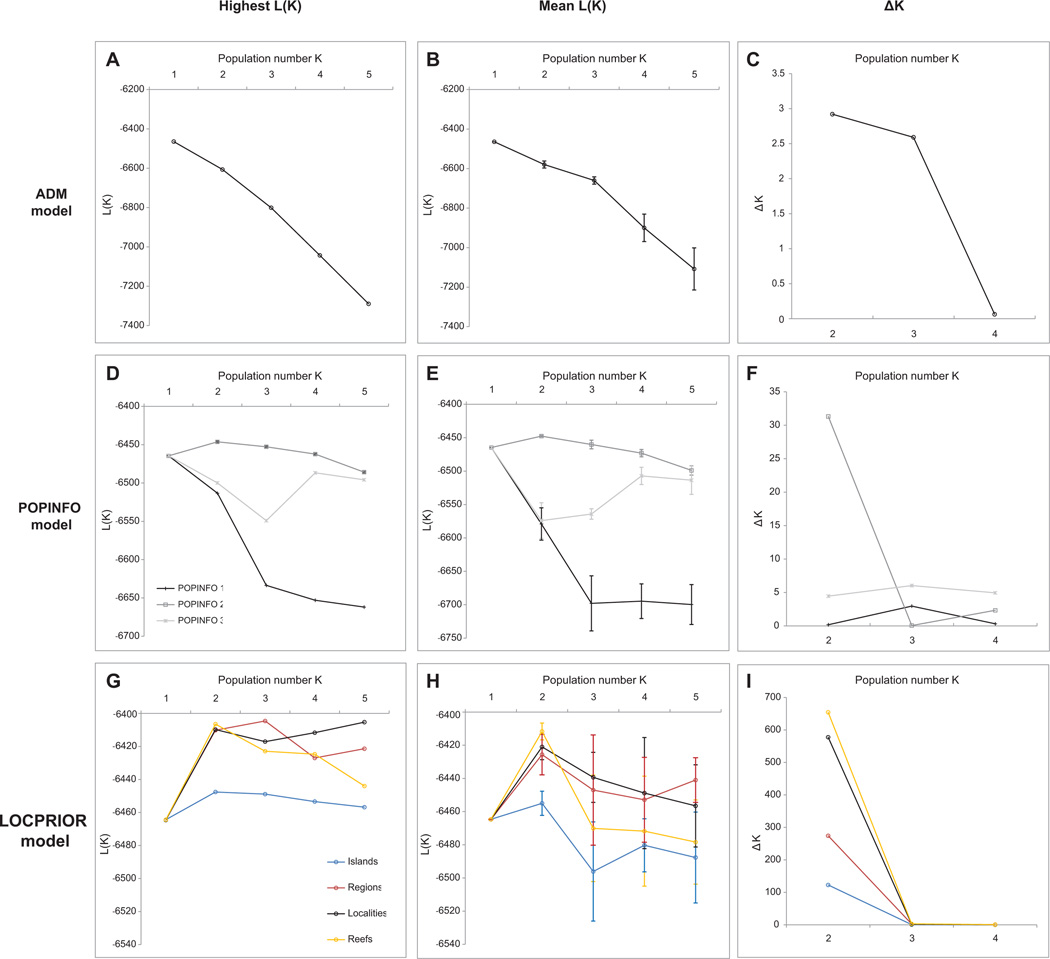
Figure 2. Results of Structure for different parameter sets.
From top to bottom, the first row contains the results of the ADM model (A, B, C), the second row contains the results of the three POPINFO models (D, E, F), the third row (G, H, I) contains the results of the LOCPRIOR model for the four grouping variants proposed to explore the dataset at different scales. A, D and G plot the highest L(K) out of ten runs for each K assumed a priori. B, E and H plot the mean L(K) and standard deviation (vertical whiskers) over the ten runs for each K. C, F, and I plot ΔK, following Evanno et al.(2005).

