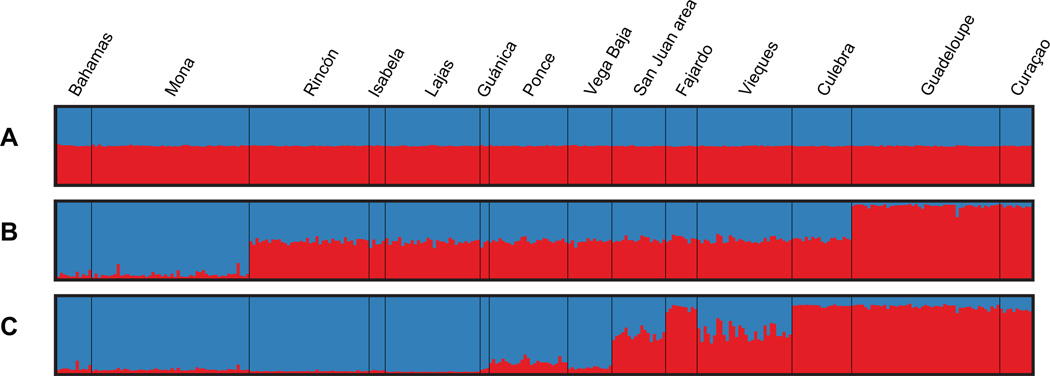
Figure 3. Structure results for K = 2 with the three parameter sets defined in this study.
All parameter sets used the admixture algorithm and performed 5,000,000 burn-in followed by 15,000,000 iterations per run. Each figure plots the mean assignments of each individual genotype to K a priori populations (here K=2) among 10 replicate runs. A. ADM parameter set: admixture without a priori information. B. POPINFO 2 parameter set: admixture model with the Bahamas and Mona a priori assigned in a first population (Western population, blue), and Guadeloupe and Curaçao a priori assigned in a second population (Eastern population, red). C. LOCPRIOR parameter set run with a priori information for the 14 localities.

