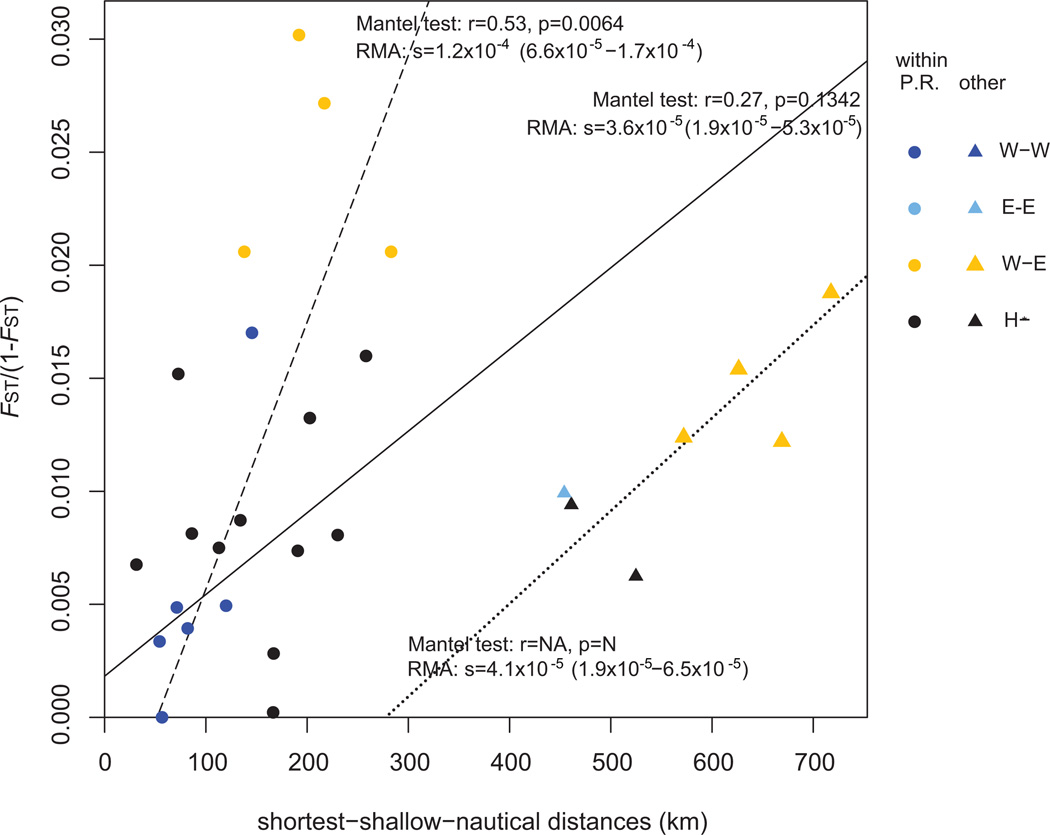
Figure 5. Pair-wise genetic distances in function of pair-wise shortest-shallow-nautical distances.
The following population assignments were based on Structure results using the LOCPRIOR option and K = 2. E-E: Pair-wise comparisons within the Eastern population. W-W: Pair-wise comparisons within the Western population. W-E: Pair-wise comparisons between Western and Eastern populations. H-*: Pair-wise comparisons involving admixed localities (San Juan area and/or Vieques). RMA regression for all points is represented by the full line. Two additional regressions were also performed to test the difference in IBD strength within Puerto Rico (circles, dash line) or with alternate locations (involving Curaçao, Bahamas and/or Guadeloupe; triangles, dot line). For each group, Mantel test and RMA regression results between FST/(1-FST) and geographic distances are appended next to the corresponding line whenever possible.

