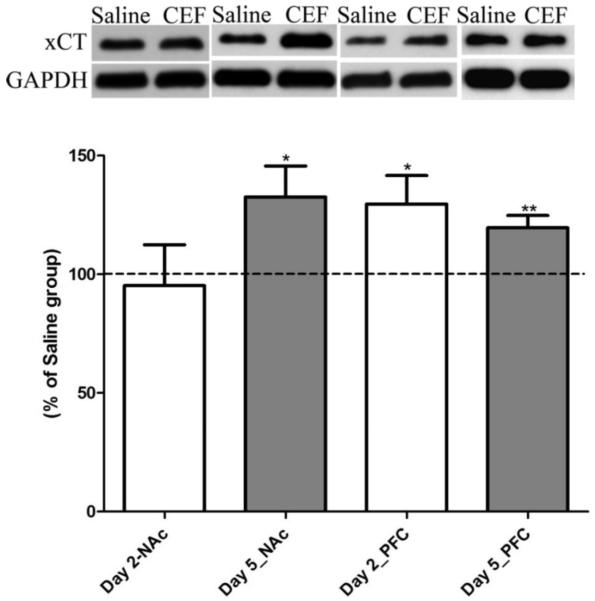
Figure 3.
Effect of ceftriaxone treatment on the expression of xCT in the nucleus accumbens (NAc) and prefrontal cortex (PFC) compared to the respective saline-treated control groups. Representative immunoblot for xCT and GAPDH (loading control) expression along with quantitative analysis comparing ratios of xCT/GAPDH expression between saline- (served as 100%) and ceftriaxone-treated P rats for the corresponding brain regions. Data are expressed as mean ± SEM. (*p<0.05; **p<0.01).

