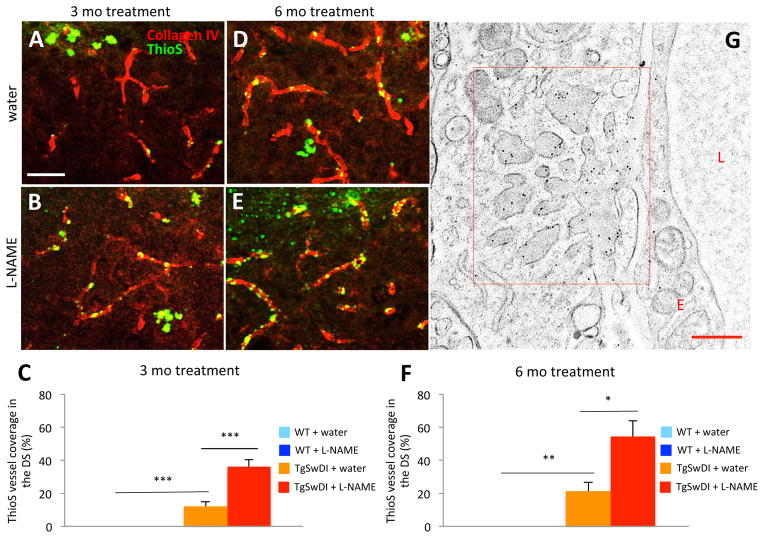
Figure 2. Hypertensive TgSwDI mice exhibit increased vascular Aβ deposition.
ThioS (green) and an anti-collagen IV antibody (red) were used to determine levels of CAA in normotensive (A,D) and hypertensive (B,E) TgSwDI mice. CAA levels were significantly increased after 3 (B,C) and 6 (E,F) months of L-NAME treatment (***p<0.001 or **p<0.01 normotensive TgSwDI vs. normotensive WT; ***p<0.001 or *p<0.05 normotensive vs. hypertensive TgSwDI; scale bar=50 μm; n=7–8/group). (G) Microvascular Aβ deposition, observed by immunoelectron microscopy, appeared as dark finger-like projections adhering to the basement membrane of capillaries in hypertensive TgSwDI brains (L, lumen; E, endothelial cell; scale bar=500 nm).

