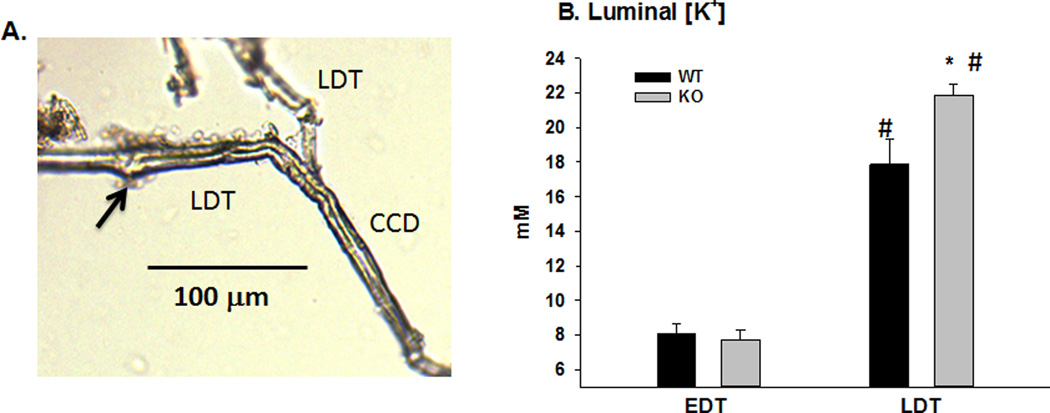
Figure 5. Microelectrode localization and measurements of luminal [K+] in distal tubules.
A. Photograph of latex cast of late distal tubule (LDT) showing the distance from the site of microelectrode puncture (arrow) to the cortical collecting duct (CCD). B. Bar plots illustrating the luminal [K+] in the early (EDT) and late distal tubules (LDT). *P < 0.05 vs WT; # P < 0.05 vs EDT.

