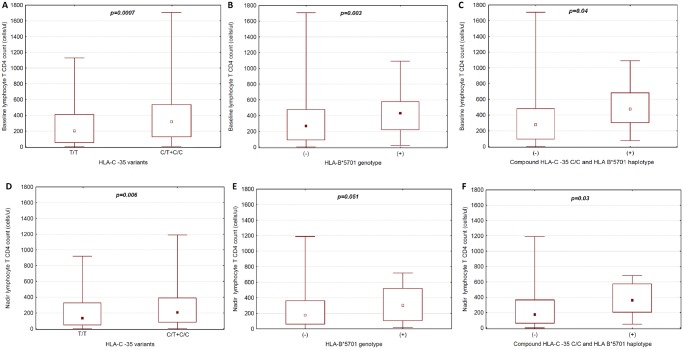
Fig 2. Box-whisker plot of the relationship between baseline lymphocyte CD 4 cell count and (a) HLA-C locus -35 genotypes for T/T homozygotes vs. C allele carriers (C/T+C/C), (b) HLA B*5701 genotype, (c) compound HLA-C locus -35 C/C and HLA B*5701 haplotype as well as nadir lymphocyte CD 4 cell count and (d) HLA-C locus -35 genotypes for T/T homozygotes vs. C allele carriers (C/T+C/C), (e) HLA B*5701 (+) genotype, (f) compound HLA-C locus -35 C/C and HLA B*5701(+) haplotype.
Boxes are IQR. Whiskers are CD4 count ranges. Central square inside a box represents a median. For statistics U-Mann-Whitney test was implemented.

