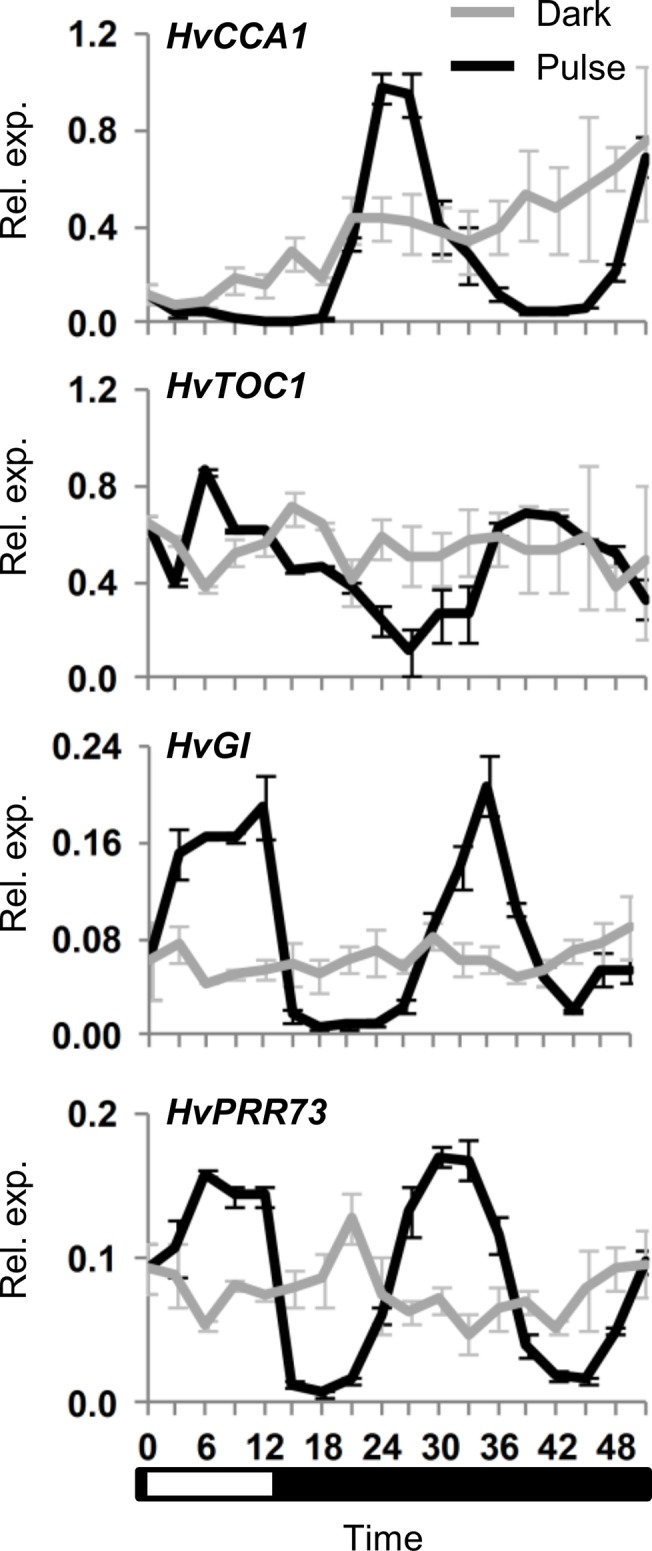
Fig 3. Initiation of circadian oscillations following a single light pulse.

Clock gene expression, assayed by qRT-PCR, in 5 day old barley seedlings (cv. Sonja) germinated and grown in constant darkness then exposed to a 12 hour light pulse (black line) versus control plants maintained in darkness (grey line). RNA was extracted from 3 biological repeats. Average expression is shown relative to ACTIN (Rel. exp.), error bars show standard error. Horizontal axis labels indicate the time (hours) relative to when the first sample was harvested. The white and black bar indicates duration of the light period relative to sampling timepoints (white corresponds to the light period).
