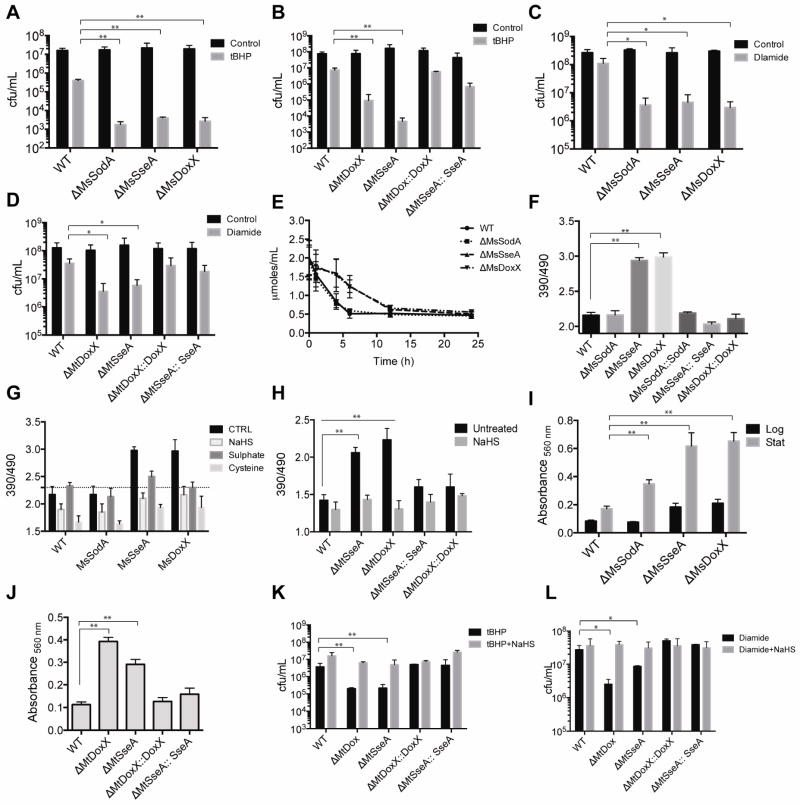
Figure 3. Sensitivity of sodA, sseA and doxX mutant strains to redox stressors.
Effect of tBHP on viability of Msm WT and mutant strains A] and Mtb WT and mutant strains B]. Log phase cultures of the indicated strains were exposed to 1 mM tBHP for 1h and CFU were enumerated. Values represent the mean ± S.E. of duplicate determinations of experiments repeated thrice. **indicates p < 0.01 by unpaired student’s t test. The effect of diamide on Msm WT and mutant strains C] and Mtb WT and mutant strains D] was determined. CFUs were measured after 12 h of treatment with 5 mM diamide. Values represent the mean ± S.E. of duplicate determinations of experiments repeated thrice. *indicates p < 0.05 by unpaired student’s t test. E] Conversion of diamide to hydrazine was measured spectrophotometrically at 390 nM at the indicated time points. Values represent the mean ± S.E. (error bars) of three independent experiments. The rate of diamide conversion for Msm WT and ΔMsSodA was 0.24±0.08 and 0.21±0.07 μmoles/mL/h, respectively, and ΔMsDoxX and ΔMsSseA was 0.10±0.05 and 0.10±0.04 μmoles/mL/h, respectively. Ratiometric sensor response of Mrx1-roGFP2 was measured from the indicated Msm strains F] and Mtb strains H] by determining the fluorescence emission at 510 nm after excitation at 390 nm and 490 nm, which indicates the relative abundance of the oxidized and reduced roGFP respectively. Data are representative of three independent experiments. **indicates p < 0.01 by unpaired student’s t test. G] The redox state of the mycothiol pool was assessed during oxidative stress using the Mrx1-roGFP2 sensor. The indicated strains were exposed to 100 μM of cysteine, sodium sulfate or NaHS for 1 h and the ratiometric sensor response was measured. Lipid hydroperoxides were measured after incubation with FOX2 reagent, in Msm WT and mutant strains I] and Mtb WT and mutant strains J]. Data are normalized relative to the cell mass. “Log” and “Stat” represent exponential and stationary phases of growth. Data represent the mean of three independent replicates ± S. E. (error bars). **indicates p < 0.01 by unpaired student’s t test. The effect of pretreatment with 100 μM NaHS for 1 h on tBHP K] and diamide L] sensitivity of Mtb WT and mutant strains was determined. CFUs were enumerated. Values shown represent the mean ± S.E. of duplicate determinations of experiments repeated twice. **indicates p < 0.01 and *indicates p < 0.05 by unpaired student’s t test.

