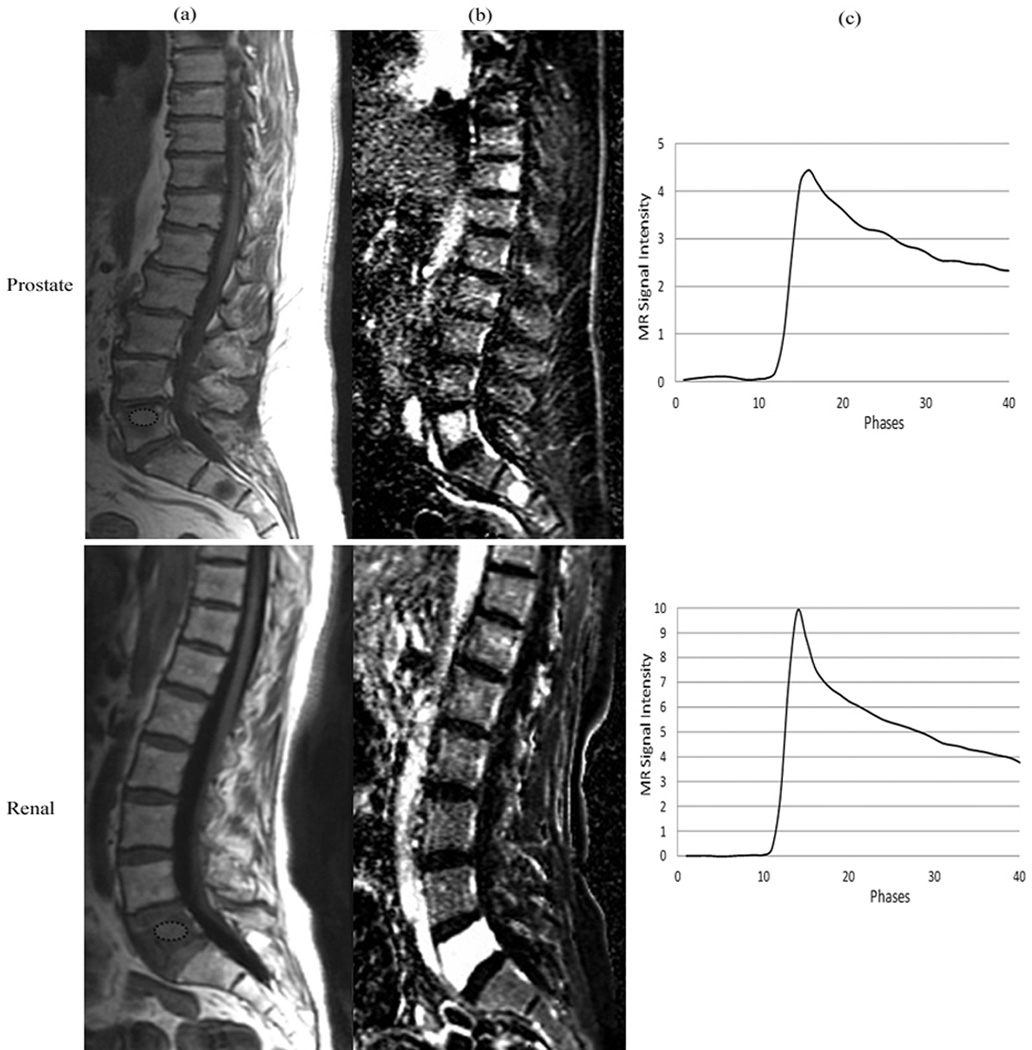
Figure 1.

(a) Representative sagittal T1-weighted MR images depicting metastatic spinal lesions (encircled) originating from prostate and renal cell carcinoma. (b) Dynamic images from DCE-MRI illustrating the hyperintensity at the spinal levels that contain metastatic lesions. (c) MRI signal intensity time curves obtained from the region of interest (encircled) in the spinal lesions.
