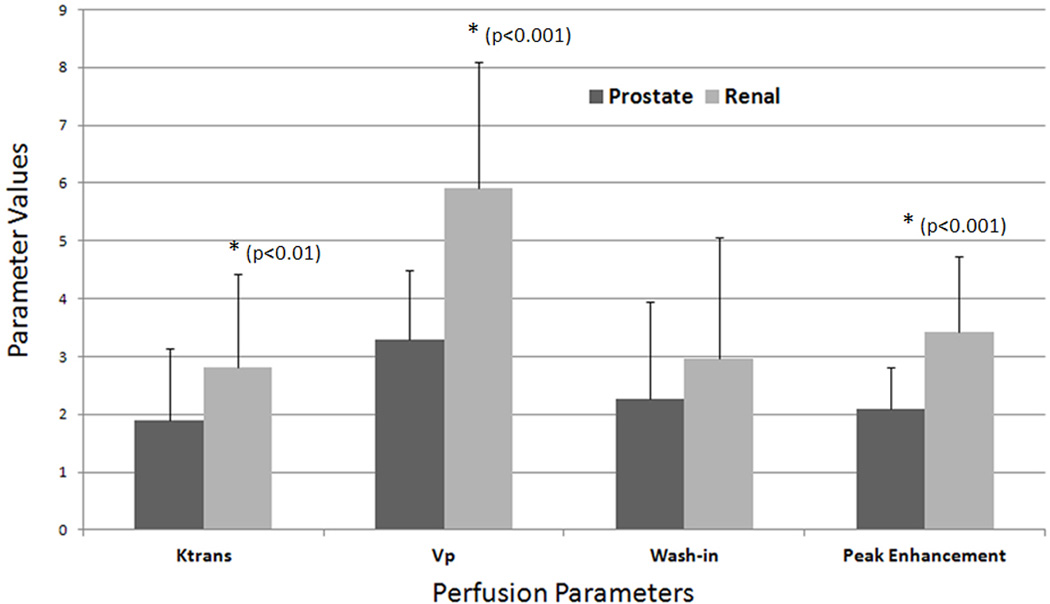
Figure 3.

A bar graph illustrating the mean values and standard deviations for the DCE-MRI perfusion parameters Ktrans (1/sec), Vp (1/sec), wash-in, and peak-enhancement in metastatic spinal lesions originating from prostate and renal cell carcinoma. The spinal lesions from prostate carcinoma recorded a µ = 1.90/sec and SD = 1.23/sec for Ktrans, µ = 3.29/sec and SD = 1.19/sec for Vp, µ = 2.26/sec and SD = 1.70/sec for wash-in, and µ = 2.09/sec and SD = 0.73/sec for peak-enhancement. The spinal lesions from renal cell carcinoma recorded a µ = 2.80/sec and SD = 1.62/sec for Ktrans, µ = 5.92/sec and SD = 2.18/sec for Vp, µ = 2.97/sec and SD = 2.09/sec for wash-in, and µ = 3.42/sec and SD = 1.32/sec for peak-enhancement.
