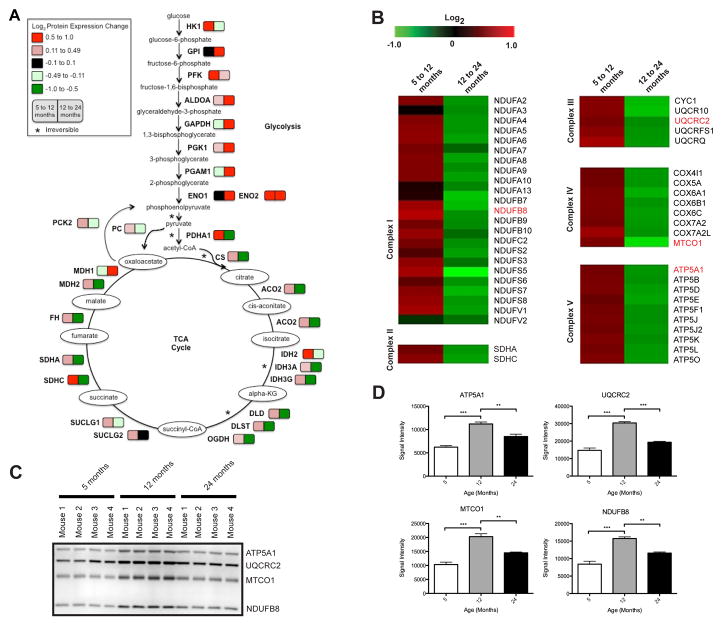
Figure 2. Metabolic pathways affected by aging associated mitochondrial protein expression changes.
A) Glycolysis and TCA cycle. The colors represent log2 expression changes for proteins in brain mitochondria from mice at 12 versus 5 months and 24 versus 12 months of age. B–D) OXPHOS. B) The protein expression changes from 5 to 12 months and 12 to 24 months in brain mitochondria (log2 (12/5 months)) and (log2 (24/12 months)). Proteins verified orthogonally are highlighted in red. C) Immunoblot orthogonal validation of selected proteins in (B). D) Statistical analysis of immunoblot signal intensity in (C). * p ≤ 0.05, ** p ≤ 0.001, and *** p ≤ 0.0001.

