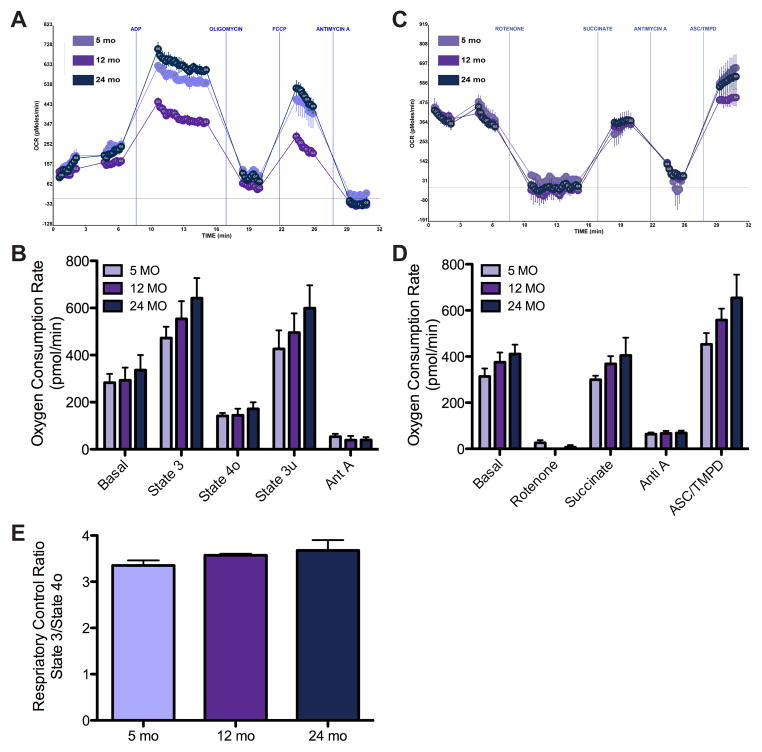
Figure 3. Brain mitochondria show no significant change in bioenergetics with age.
A) Representative OCR curves of brain mitochondria coupling assay with the substrate succinate and sequential additions of ADP, oligomycin, FCCP, and antimycin A. B) Bar graph summary of basal (complex II), state 3, state 4o, and state 3u respiration, n = 5. C) Representative OCR graph output of the electron flow assay with substrates pyruvate and malate and sequential additions of rotenone, succinate, antimycin A, and ACS/TMPD. D) Bar graph representation of rotenone inhibition of complex I, succinate driven complex II, antimycin A inhibition of complex III, and ASC/TMPD driven complex IV respiration, n = 5. E) RCR (state 3/4o) reveals no change between isolated brain mitochondria at 5, 12, and 24 months.

