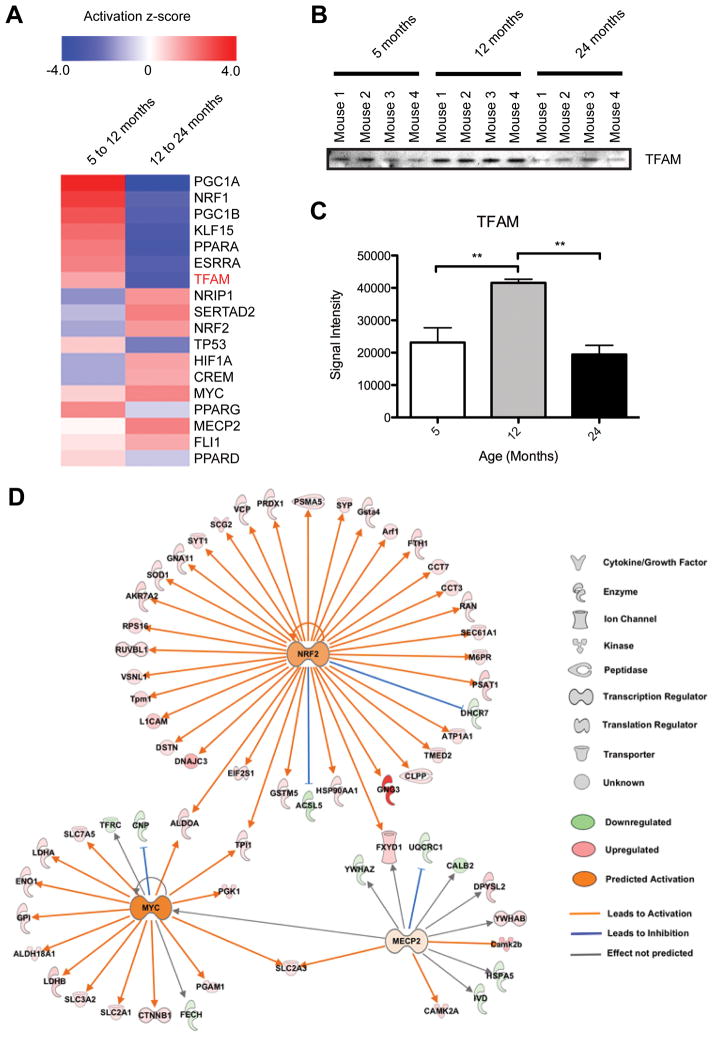
Figure 4. Age-associated alterations in transcriptional regulators predicted from brain mitochondria quantitative proteomic data.
A) IPA generated heat map showing predicted activation z-scores for several transcriptional regulators important for mitochondrial biogenesis and function. Protein verified orthogonally is highlighted in red. B) Immunoblot orthogonal validation of TFAM in (A). C) Statistical analysis of TFAM immunoblot signal intensity in (B). ** p ≤ 0.001. D) IPA generated NRF2, MYC, and MECP2 upstream regulator networks overlaid with our proteomic expression data for brain mitochondria from 5 to 24 month old mice. All proteins shown (except the nuclear proteins NRF2, MYC, and MECP2) were found in the proteomic analysis.

