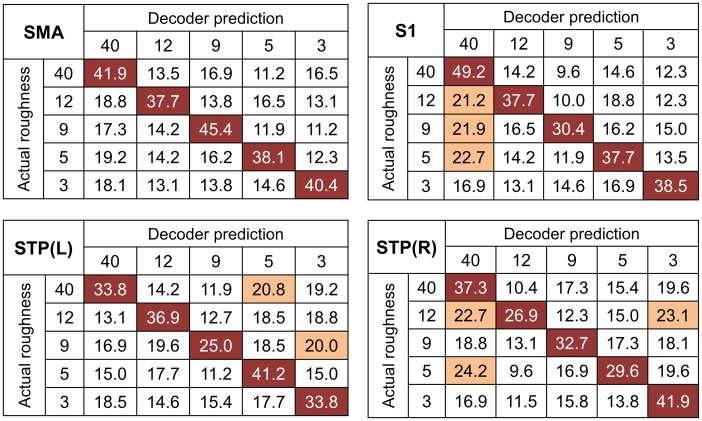
Fig 3. Confusion matrices for decoder predictions of fMRI activity in the significant clusters.
The rows of the matrix indicate the actual roughness provided to the participants and the columns indicate the predictions by a neural decoder. The cells of highest accuracy in each row are highlighted in red and the frequent confusions, of which the misclassification rates exceeded the chance level (20%), are highlighted in light red.

