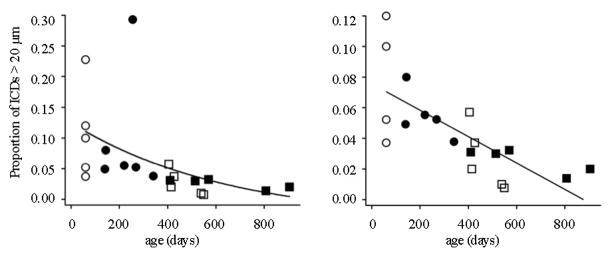
Figure 10. Prevalence of long-range contacts across experimental groups.

Left panel, For each owl the proportion of ICDs >20 μm to all ICDs was collapsed across all functional zones and plotted vs age at sacrifice: open circles = NJ (n=5), filled circles = PA (n=6), open squares = NA (n=6), filled squares = PR (n=5). Data were slightly better fit with a power function (shown) or exponential than linear regression (Pearson R = −0.48, p <0.027) and best fit with Spearman rank correlation (R = −0.78, p < 0.00003), which is more resistant to outliers. Right panel, Same data with the two outlier data points removed (one NJ and one PA which exceeded the mean +/− 2 SD = 0.208). These data were best fit with linear regression (Pearson R = −0.73, p < 0.00058).
