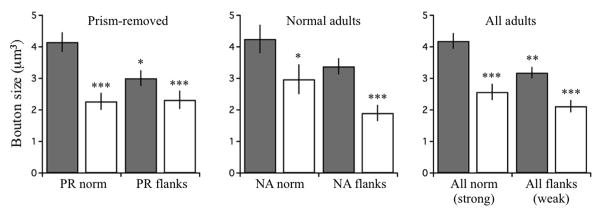
Figure 12. Bouton volume.

Bouton volumes for PR owls, NA owls and all adults. Grey bars represent boutons that contacted CaMKII+ dendrites (“C+”). Open bars represent boutons that did not (“C−”). Data were binned according to functional strength at time of analysis: PR norm are functionally strong; PR flanks, weak; NA norm, strong; NA flanks, weak. Mann-Whitney U test: PR norm C+ (n=232) vs PR norm C− (n=81), p=0.0004; PR norm C+ vs PR flank C+ (n=218), p=0.0147; PR norm C+ vs PR flank C− (n=84), p=0.0007; NA norm C+ (n=132) vs NA norm C− (n=60), p=0.0280; NA norm C+ vs NA flank C+ (n=182), p=0.1757; NA norm C+ vs NA flank C− (n=79), p<0.00001; All norm C+ (n=364) vs All norm C− (n=141), p=0.00006; All norm C+ vs All flank C+ (n=400), p=0.0068; All norm C+ vs All flank C− (n=163), p=0.000002. One asterisk = P<0.05, two asterisks = p<0.01, 3 asterisks = p<0.001.
