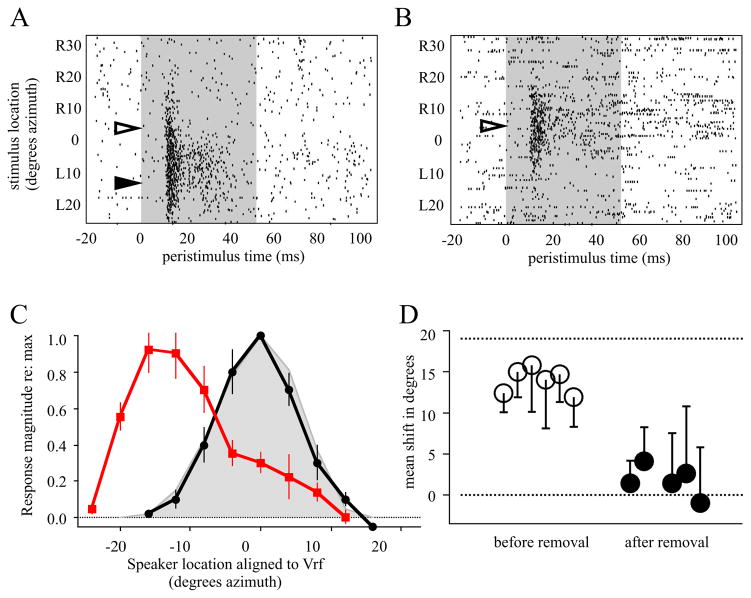
Figure 4. Electrophysiological mapping.
A, Raster plot of auditory tuning in an owl adapted to R19° prisms. Shaded region indicates duration of sound stimulus, action potentials are represented by ticks. The visual receptive field was centered at R4° (open arrowhead), which predicts auditory responses at L13° (solid arrowhead) for full adaptation. At this time point learned responses were strong while normal responses were weak to modest. B, Recording from the same owl 75d after prism removal. The visual receptive field was centered at R5° (open arrowhead). The previously learned responses were no longer expressed, and strong normal responses had been re-expressed. C, Population tuning curves for owl PR3. Each curve was normalized to maximum response and aligned to the visual receptive field (Vrf) measured with prisms off. Error bars are standard error. Red, mapping prior to prism removal. Black, maping 75d after prism removal. Grey, composite for normal adult owls (data from this and other studies). D, Mean adaptive shifts for owls prior to prism removal (n=6, open circles) and after (n=5, filled circles). Error bars are standard deviation.

