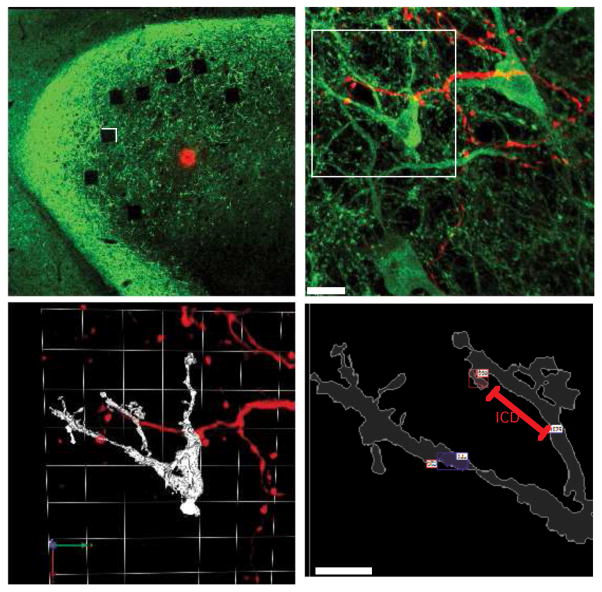
Figure 5. Labeling and analysis of the axo-dendritic interface.
A, Low magnification image of a horizontal section through L midbrain of a prism-removed adult. The injection site (red dot) is in the ICCls at the representation of ~ 20 μs. The labeled axons, not easily visible at this magnification, terminate primarily in ICX. Immunoreactivity for CaMKII is shown in green. The spatial density of CaMKII+ labeling is highest in ICX. Photobleached squares indicate the locations of high magnification image fields (96 μm per side) used for quantitative analysis. See Rodriguez-Contreras et al., 2005, and McBride et al., 2008 for additional images. B, Confocal image stack, 63x objective. The field corresponds to the white box region in A. Multiple CaMKII+ somata are visible within the dense plexus of CaMKII+ dendrites, as are a smaller number of tracer-labeled axons. Synapse-sized overlap objects are yellow. Scale bar = 10 μms. C, 3D reconstruction of the upper left quadrant (white box in B). CaMKII+ neuron is rendered in white, tracer-labeled axons in red. The arrows (lower left) and white grid represent the orientation and coordinate frame for 3D visualization and analysis D, Zoomed view of two dendritic branches receiving sparse axo-dendritic contacts (small red and blue boxes with white labels) from the tracer-labeled axons. Contacts were identified according to criteria outlined in the Methods. The two boxes on the lower branch correspond to a single contact as they are within the 2 μm threshold. The two boxes on the upper branch are separate contacts. ICD (inter-contact distance) was measured as a straight line along the dendritic path. Scale bar = 5 μms.

