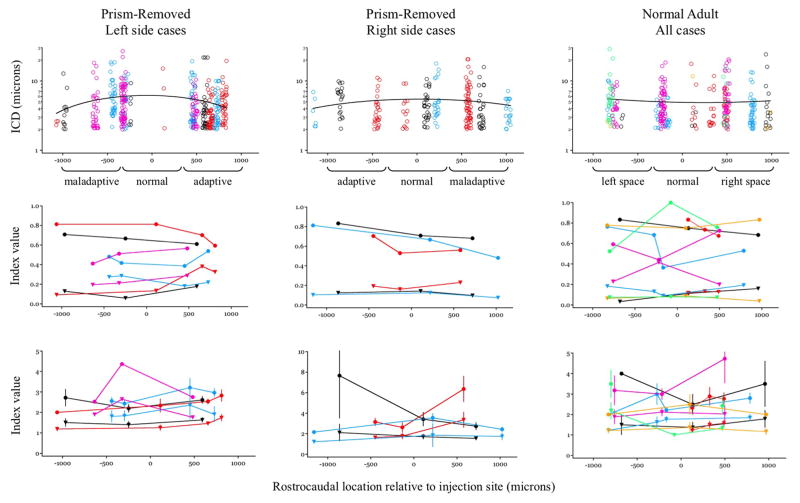
Figure 6. Input clustering in PR and NA owls.
Top panels, ICD vs rostocaudal location for adult owls. PR owls were separated into left side cases (n=4) and right side cases (n=3) because the adaptive direction is opposite. NA cases (n=6) were pooled. Each case is color-coded and plotted relative to the rostrocaudal location of the image field. Functional zones are indicated and based on known topography, direction and magnitude of prismatic displacement. Black curves are polynomial fits. Middle panels, Between-branch targeting: Circles = BBD; Triangles = BOF. Bottom panels, Contacts per branch: Circles = MDOB; Triangles = MDAB. Error bars are standard deviation.

