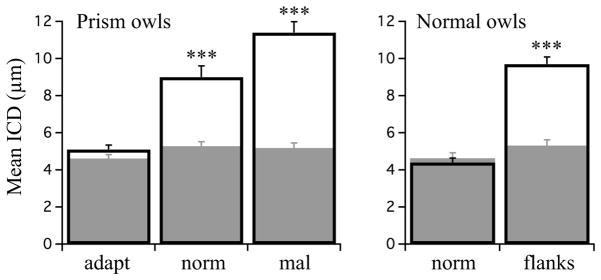
Figure 7. Mean ICD across experimental groups.

Left, mean ICD across all four experimental groups. Filled bars represent adult owls (this study); open bars represent juvenile owls (previous study). In juveniles, the strong functional zones are the adaptive zone in prism owls and the normal zone in normal owls. Clustering was greater in these zones than in functionally weak zones. In adults, in which normal zones are functional strong, clustering was similar across zones. Open bars = PA; Grey fills = PR; adapt = adaptive zone; norm = normal zone; mal = maladaptive zone. Asterisks indicate p <0.0001, Mann-Whitney U test, for within-zone comparisons PA vs PR. Right, mean ICD in normal owls. Open bars = NJ; Grey fills = NA. norm = normal zone; flanks = right and left space zones combined.
