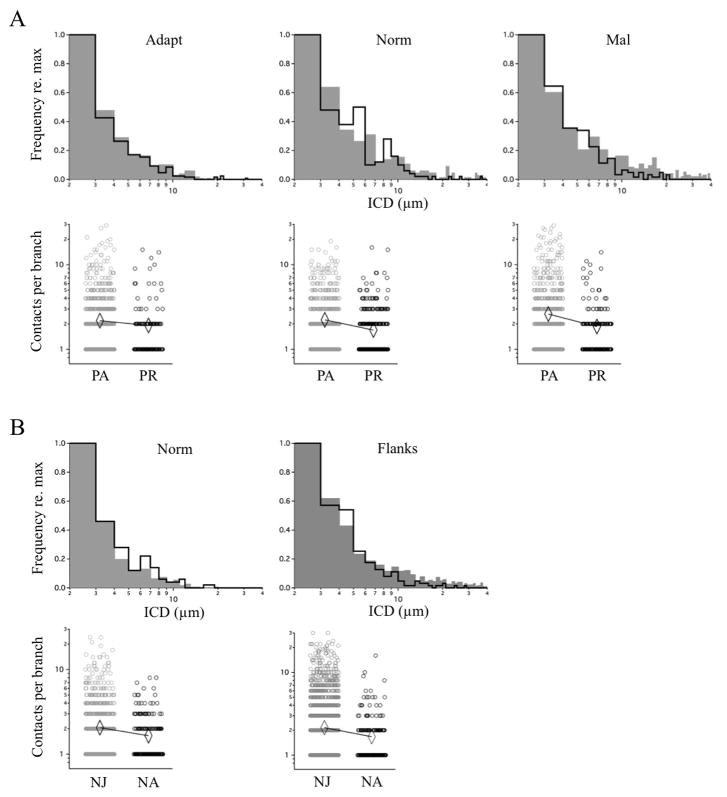
Figure 9. Age-related changes in ICD distribution and contact density.
ICD frequency histograms were constructed and overlaid with their counterparts collected in McBride et al., 2008. Within-branch contact density (number of contacts per branch) in each zone is displayed separately, with mean values indicated by diamonds. A, Prism-Adapted (grey) vs Prism-Removed (black). Upper histograms: The ICD distributions had not changed in the adaptive zone (p = 0.739; Kolmogorov-Smirnov), but had in the normal (p=0.005) and maladaptive (p<0.0001) zones, in both cases through a loss of ICDs > 10 μms. Lower scatter plots: There was a trend towards decreased contact density in all zones in Prism-Removed owls. Statistical tests (Mann-Whitney U-test) were performed on these datasets and separately on trimmed datasets containing multiply occupied branches only. Respectively, the p values were 0.1388 and <0.001 for the adaptive zone, 0.7037 and 0.009 for the normal zone, and <0.001 and <0.001 for the maladaptive zone. For data pooled across all zones, the p values were 0.1233 and <0.001. Because singly occupied branches do not yield an ICD value, the subset of multiply occupied branches represents the population subject to remodeling. The p values associated with this population were significant across all zones. B, Normal Juveniles (grey) vs Normal Adults (black). Because the L and R flanks are functionally equivalent throughout life, they were pooled together. Upper histograms: The ICD distributions had not changed in the normal zone (p=0.621) but had in the flanks (p<0.0001), again through a loss of ICDs > 10 μms. And again, in all zones there was a trend towards decreased contact density in the Normal Adults. The p values were 0.2003 and 0.018 for the left space zone, 0.2896 and 0.012 for the normal zone, and 0.1509 and 0.020 for the maladaptive zone. For data pooled across all zones, the p values were 0.0259 and <0.001. Thus, the p values associated with both the multiply occupied branch population and the entire population (including singly occupied branches) were significant.

