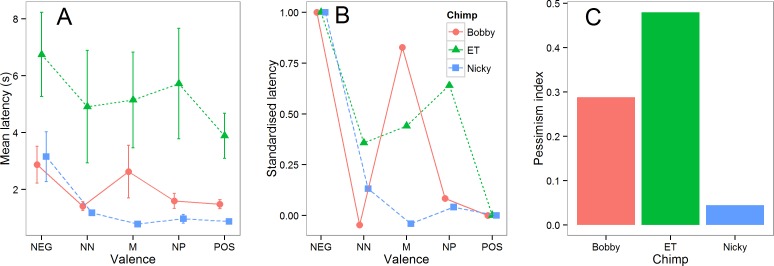
Figure 4. Summary test data.
(A) The mean latencies (±1 sem) in the five test sessions for each chimpanzee to touch cones of each valence. (B) The same data shown in (A) standardized such that the POS latency for each chimpanzee is equal to 0 and the NEG latency equal to 1. (C). The pessimism index for each of the three chimpanzees (see text for details).

