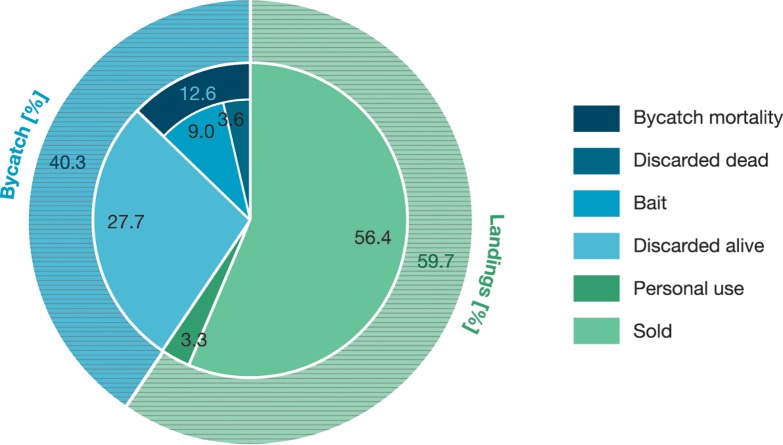
Figure 2. Catch categories and their fractions of the total catch biomass.
Fraction of the total biomass for landings and bycatch (outer circle) and the fractions of the according subcategories (inner circle) for landings (dashed green): personal use (dark green) and sold (light green), and for bycatch (dashed blue): bycatch mortality (dark blue) and dis carded alive (light blue). The bycatch mortality is divided by the fraction discarded dead and the fraction used as bait.

