
Figure 3. Logistic regression model results showing the probability of an individual to belong to bycatch or to landings depending on the individuals’ total length.
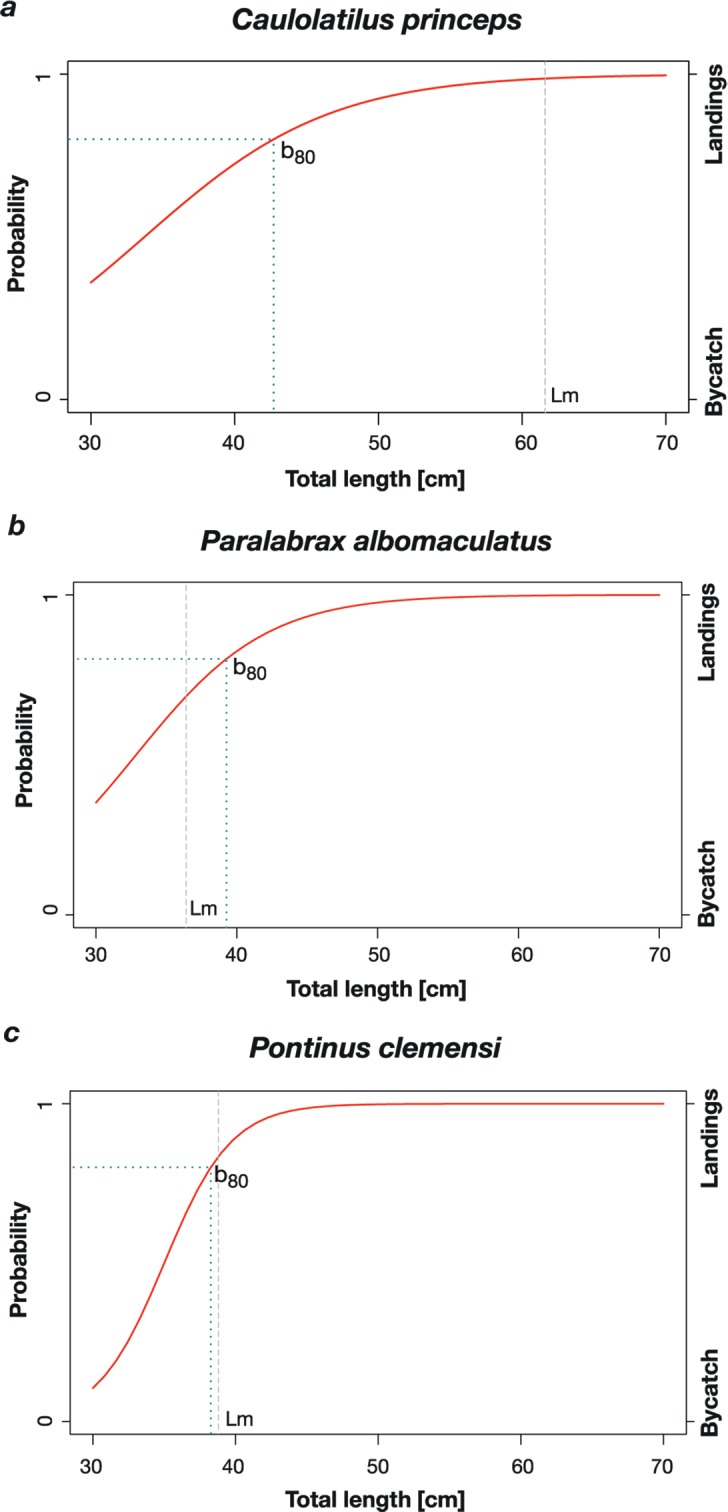
Shows the probability of an individual to belong to bycatch (0) or to landings (1) depending on the individuals’ total length. The dashed blue line indicates the b80, the dashed grey line indicates the mean size of first maturity (Lm) of the species: (A) C. princeps (n = 112, b80 = 42.7 cm TL, Lm = 61.6 cm TL, odds ratio = 1.16); (B) P. albomaculatus (n = 112, b80 = 39.2 cm TL, Lm = 36.3 cm TL, odds ratio = 1.24); (C) P. clemensi (n = 141, b80 = 38.2 cm TL, Lm = 38.8 cm TL, odds ratio = 3.25e–7).