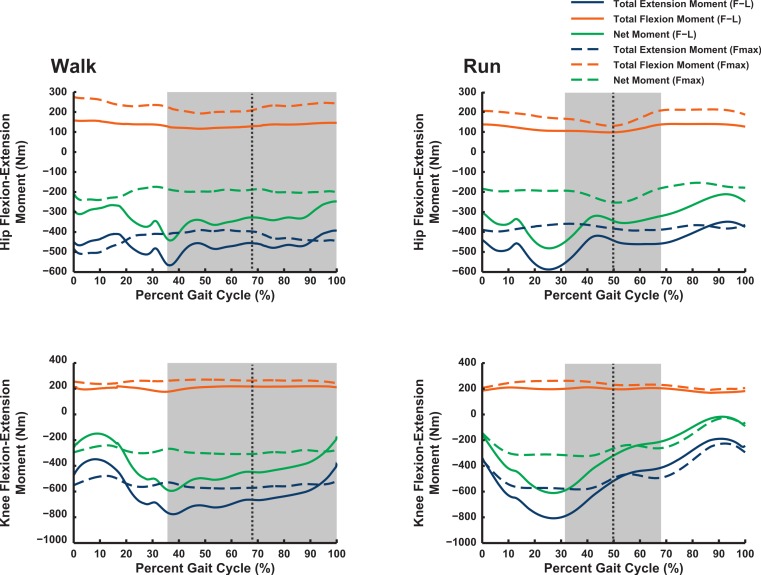
Figure 6. Maximal muscle moments about proximal limb joints (hip and knee), for representative walking and running trials (see ‘Methods’).
“F–L” curves incorporate effects of muscle force–length properties into moment calculations; “Fmax” curves only assume maximal isometric muscle stress and thus ignore F–L effects. The shaded area represents the stance phase, and the vertical dashed line is mid-stance (i.e., 50%).

