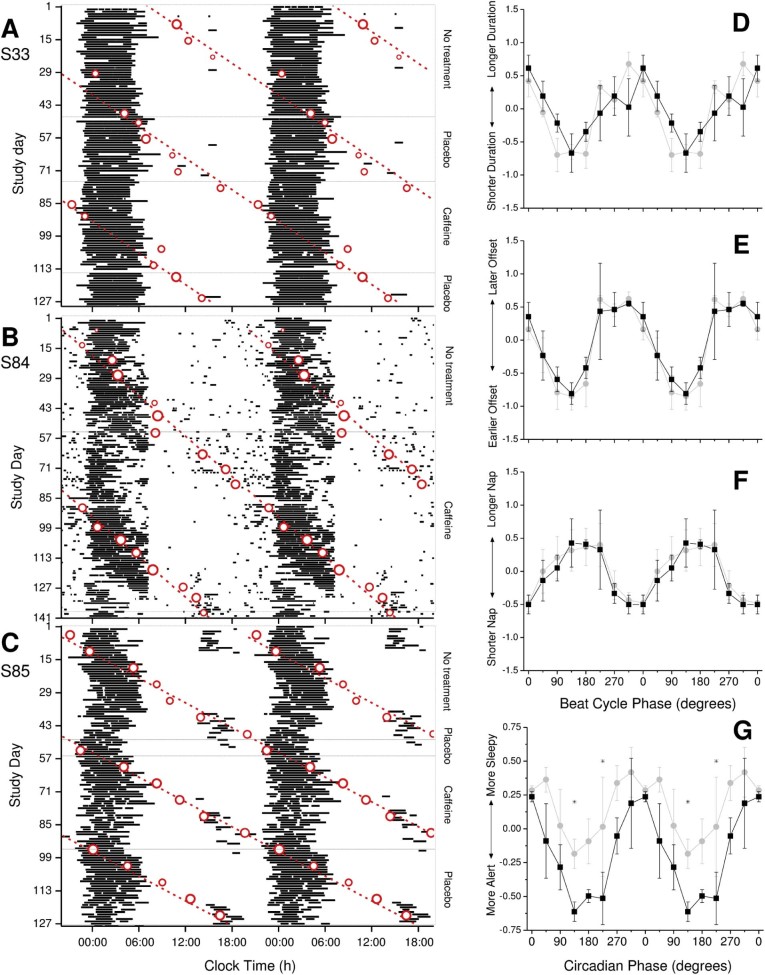
Fig. 1.
(A–C) Raster double plots of the self-reported sleep times (horizontal black bars), including naps, in totally blind participants S33 (A), S84 (B), and S85 (C). Sequential study days are shown on the ordinate and clock time is double-plotted on the abscissa. Circadian acrophases, which were estimated from cosinor fits to 48-h profiles of aMT6s rhythms, are superimposed (open circles) along with a best-fit regression line (dashed lines) to illustrate the intrinsic non-24-h period. The size of the circle is inversely proportional to the standard error of the circadian phase estimate; the best-fit regression was weighted based on these standard errors. Circadian period was estimated for each condition for each participant. S33: no treatment τ = 24.49 ± 0.21 h; placebo τ = 24.28 ± 0.27 h; caffeine τ = 24.46 ± 0.11 h. S84: no treatment τ = 24.25 ± 0.06 h; caffeine τ = 24.35 ± 0.02 h. S85: no treatment τ = 24.51 ± 0.10 h; placebo t = 24.59 ± 0.03 h; caffeine τ = 24.59 ± 0.03 h. (D–G) Nighttime sleep duration (D), sleep offset (E), and daytime nap duration (F) plotted as a function of beat cycle phase and alert–sleepy scales (G) plotted as a function of circadian phase during the placebo/no treatment (gray circles) and caffeine (black squares) arms of the study across all three participants. Each parameter was normalized in each participant as the deviation from the mean (y-axis; 45° bins), where 0° represents the time at which the midpoint of sleep (for D–F) or the rating assessment (G) coincided with the acrophase of the aMT6s rhythm (x-axis) as a function of the treatment condition (placebo/no treatment vs. caffeine). Significant circadian rhythms are indicated by filled symbols and nonsignificant rhythms by open symbols. Phase bins in which caffeine was significantly different from the placebo/no treatment condition are indicated (*).

